
Java Data Extraction User Guide
Summary
This user guide was prepared to ensure that customers understand what SAP data PowerConnect can send to Splunk, and how to optimize their environment’s configuration to maximize business value. Please review the corresponding menu options on the left for a detailed summary of each of the data types available for extraction.
View and Configure Data Extraction Events
Events collected by the PowerConnect application are associated with a Java plugin and are represented in the event_type field in Splunk. The PowerConnect events available for extraction are accessible via the General tab in the PowerConnect Java administrative console. The PowerConnect Java administrative console is accessible via the following URL (http://<serverhost>:<port>/webdynpro/resources/com.powerconnect5/spcj_wd/SapPowerConnectJava#) is used to configure and enable data extraction for the Java plugins.
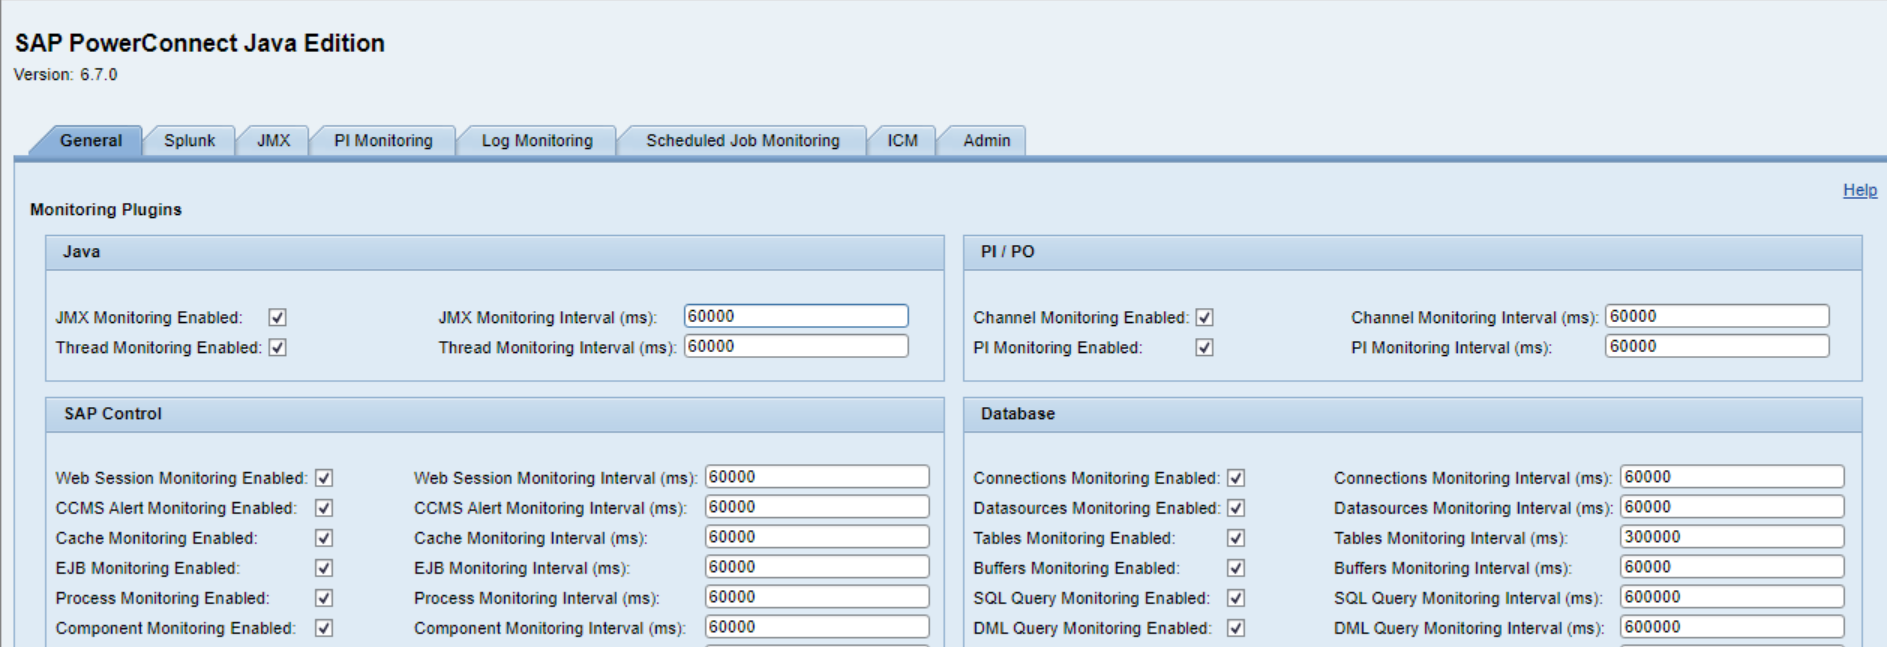
Plug-Ins
These are plugins designed to be enabled and disabled based on the monitoring requirements. These plug-ins are visible in the General tab of the PowerConnect Java administrative console. The plugins are grouped based on their type. If further configuration can be performed for the plugin, a tab for that plugin is displayed. For example there is a PI Monitoring tab which allows further configuration of the PI Monitoring plugin.
The general rule is that the PowerConnect application does not need to be restarted if plugins are enabled/disabled. The PowerConnect Java application does need to be restarted if there are changes to the data collection interval. Here are instructions on how to restart the PowerConnect Java application: Start & Stop PowerConnect Java agent.
Here is additional information on the plug-ins available as part of the PowerConnect Java application:
Name | Purpose | Option | Description | Restart of PowerConnect Required After Modification? | Default |
|---|---|---|---|---|---|
JMX | Collects JMX metrics such as heap, garbage collection and CPU | Enabled | Enables or disables plug-in | No | Enabled |
Interval | Determines how often the plugin collects data in milliseconds | Yes | 60000 | ||
Thread | Collects Java Thread information such as state, cpu time and stack trace | Enabled | Enables or disables plug-in | No | Disabled |
Interval | Determines how often the plugin collects data in milliseconds | Yes | 60000 | ||
Web Session | Collects web session information of users who are accessing the SAP system such as user name, session duration and the application they are accessing | Enabled | Enables or disables plug-in | No | Disabled |
Interval | Determines how often the plugin collects data in milliseconds | Yes | 60000 | ||
CCMS Alert | Collects CCMS alert tree for any alerts that have been configured in the CCMS alert monitor | Enabled | Enables or disables plug-in | No | Disabled |
Interval | Determines how often the plugin collects data in milliseconds | Yes | 60000 | ||
Cache | Collects cache statistics and details for various caches within SAP such as puts, gets and cache size | Enabled | Enables or disables plug-in | No | Disabled |
Interval | Determines how often the plugin collects data in milliseconds | Yes | 60000 | ||
EJB | Collects EJB statistics such as response time, number of requests and the user who executed the EJB | Enabled | Enables or disables plug-in | No | Disabled |
Interval | Determines how often the plugin collects data in milliseconds | Yes | 60000 | ||
Scheduled Job | Collects information about Scheduled Jobs running on the SAP system such as status, start time, end time and CPU consumption | Enabled | Enables or disables plug-in | No | Disabled |
Interval | Determines how often the plugin collects data in milliseconds | Yes | 60000 | ||
Channel | Collects information about status of PI Channels including the recent logs | Enabled | Enables or disables plug-in | No | Disabled |
Interval | Determines how often the plugin collects data in milliseconds | Yes | 60000 | ||
PI | Collects PI message data including optional payload and logs | Enabled | Enables or disables plug-in | No | Disabled |
Interval | Determines how often the plugin collects data in milliseconds | Yes | 60000 | ||
Portal Activity | Collects SAP Portal Activity logs | Enabled | Enables or disables the plugin | Yes | Disabled |
Default Trace | Collects SAP Default Trace logs | Enabled | Enables or disables the plugin | Yes | Disabled |
Application Trace | Collects SAP Application Trace logs | Enabled | Enables or disables the plugin | Yes | Disabled |
Security Log | Collects SAP Security Logs | Enabled | Enables or disables the plugin | Yes | Disabled |
Security Audit Log | Collects SAP Security Audit Logs | Enabled | Enables or disables the plugin | Yes | Disabled |