
KB 147 - A custom JavaScript caused an issue loading your dashboard
KB 147 (Splunk): A custom JavaScript caused an issue loading your dashboard
Category: Problem | Priority: Normal |
|---|---|
Platform: Splunk On-Prem and Splunk Cloud | Version: 1 |
Description
When interacting with certain dashboard, users of PowerConnect Splunk app get a pop up as below:
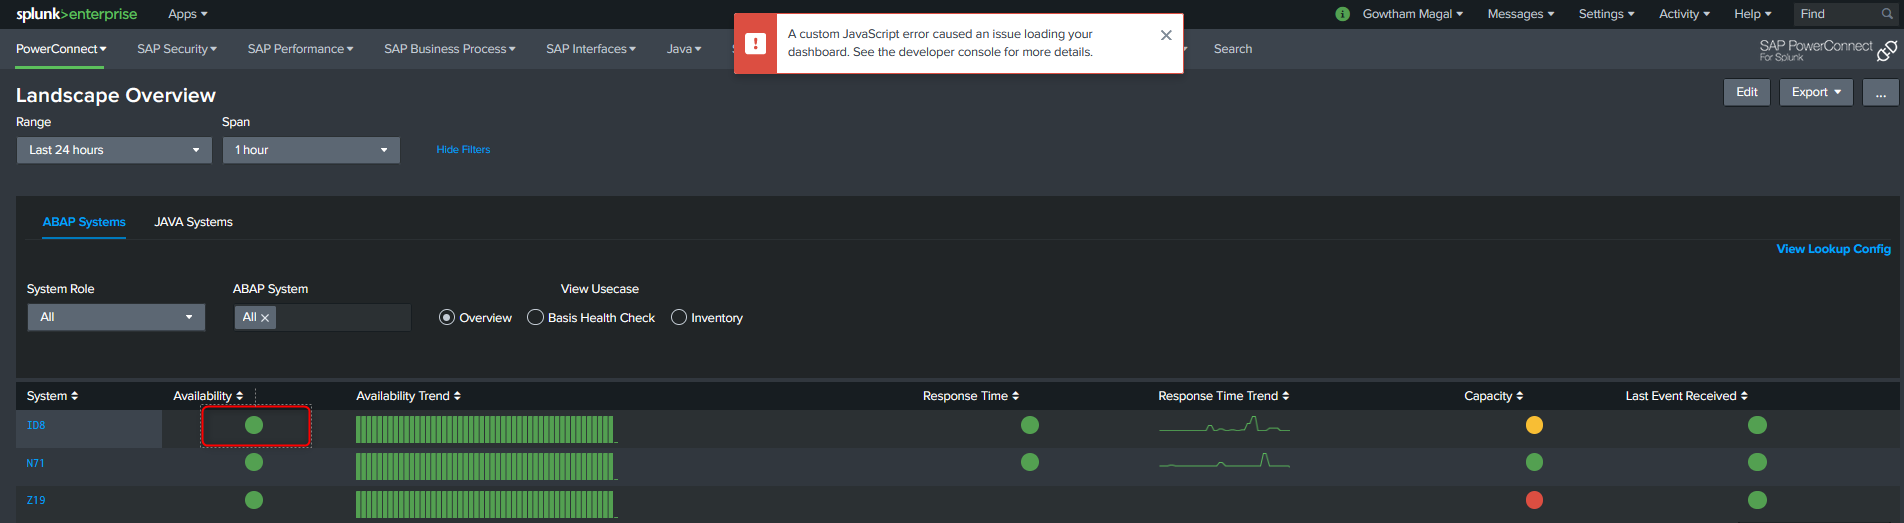
This issue is noticed in the “Landscape Overview” dashboard and is triggered when the users interact with the dashboard by clicking the bubble in Availability column.
This issue is currently noticed only on Splunk version 8.2.5 and is not dependent of the PowerConnect app version.
Cause
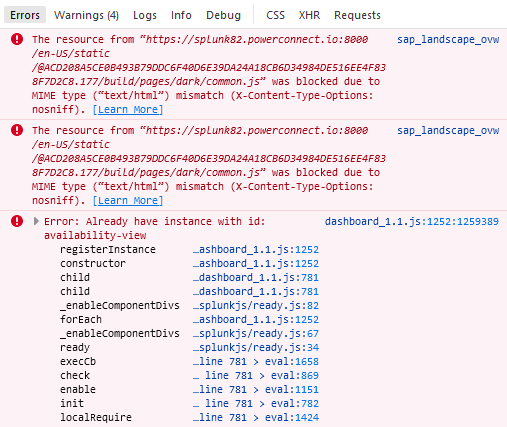
Upon investigation in the development console as per the modals suggestion, you may notice errors like this. The actual error on the page may be slightly different.
Resolution
Currently the resolution of this issue is unknown and we are working on this issue. This webpage will be updated with the resolution once available.
Additional information
This issue is not believed to be critical since the dashboards still run and the data is visible despite the error.
Product Version
Product | From | To |
PowerConnect Splunk app | 6.x | 6.x |