MSS_DB02_STMT
Data Description
The MSS_DB02_STMT event is used in SAP to view SQL statements for a Microsoft SQL database.
Potential Use Cases
This event could be used in the following scenarios:
Identify problematic SQL statements in the environment.
Correlate application performance to SQL statements.
Create alerts for poor performing SQL statements.
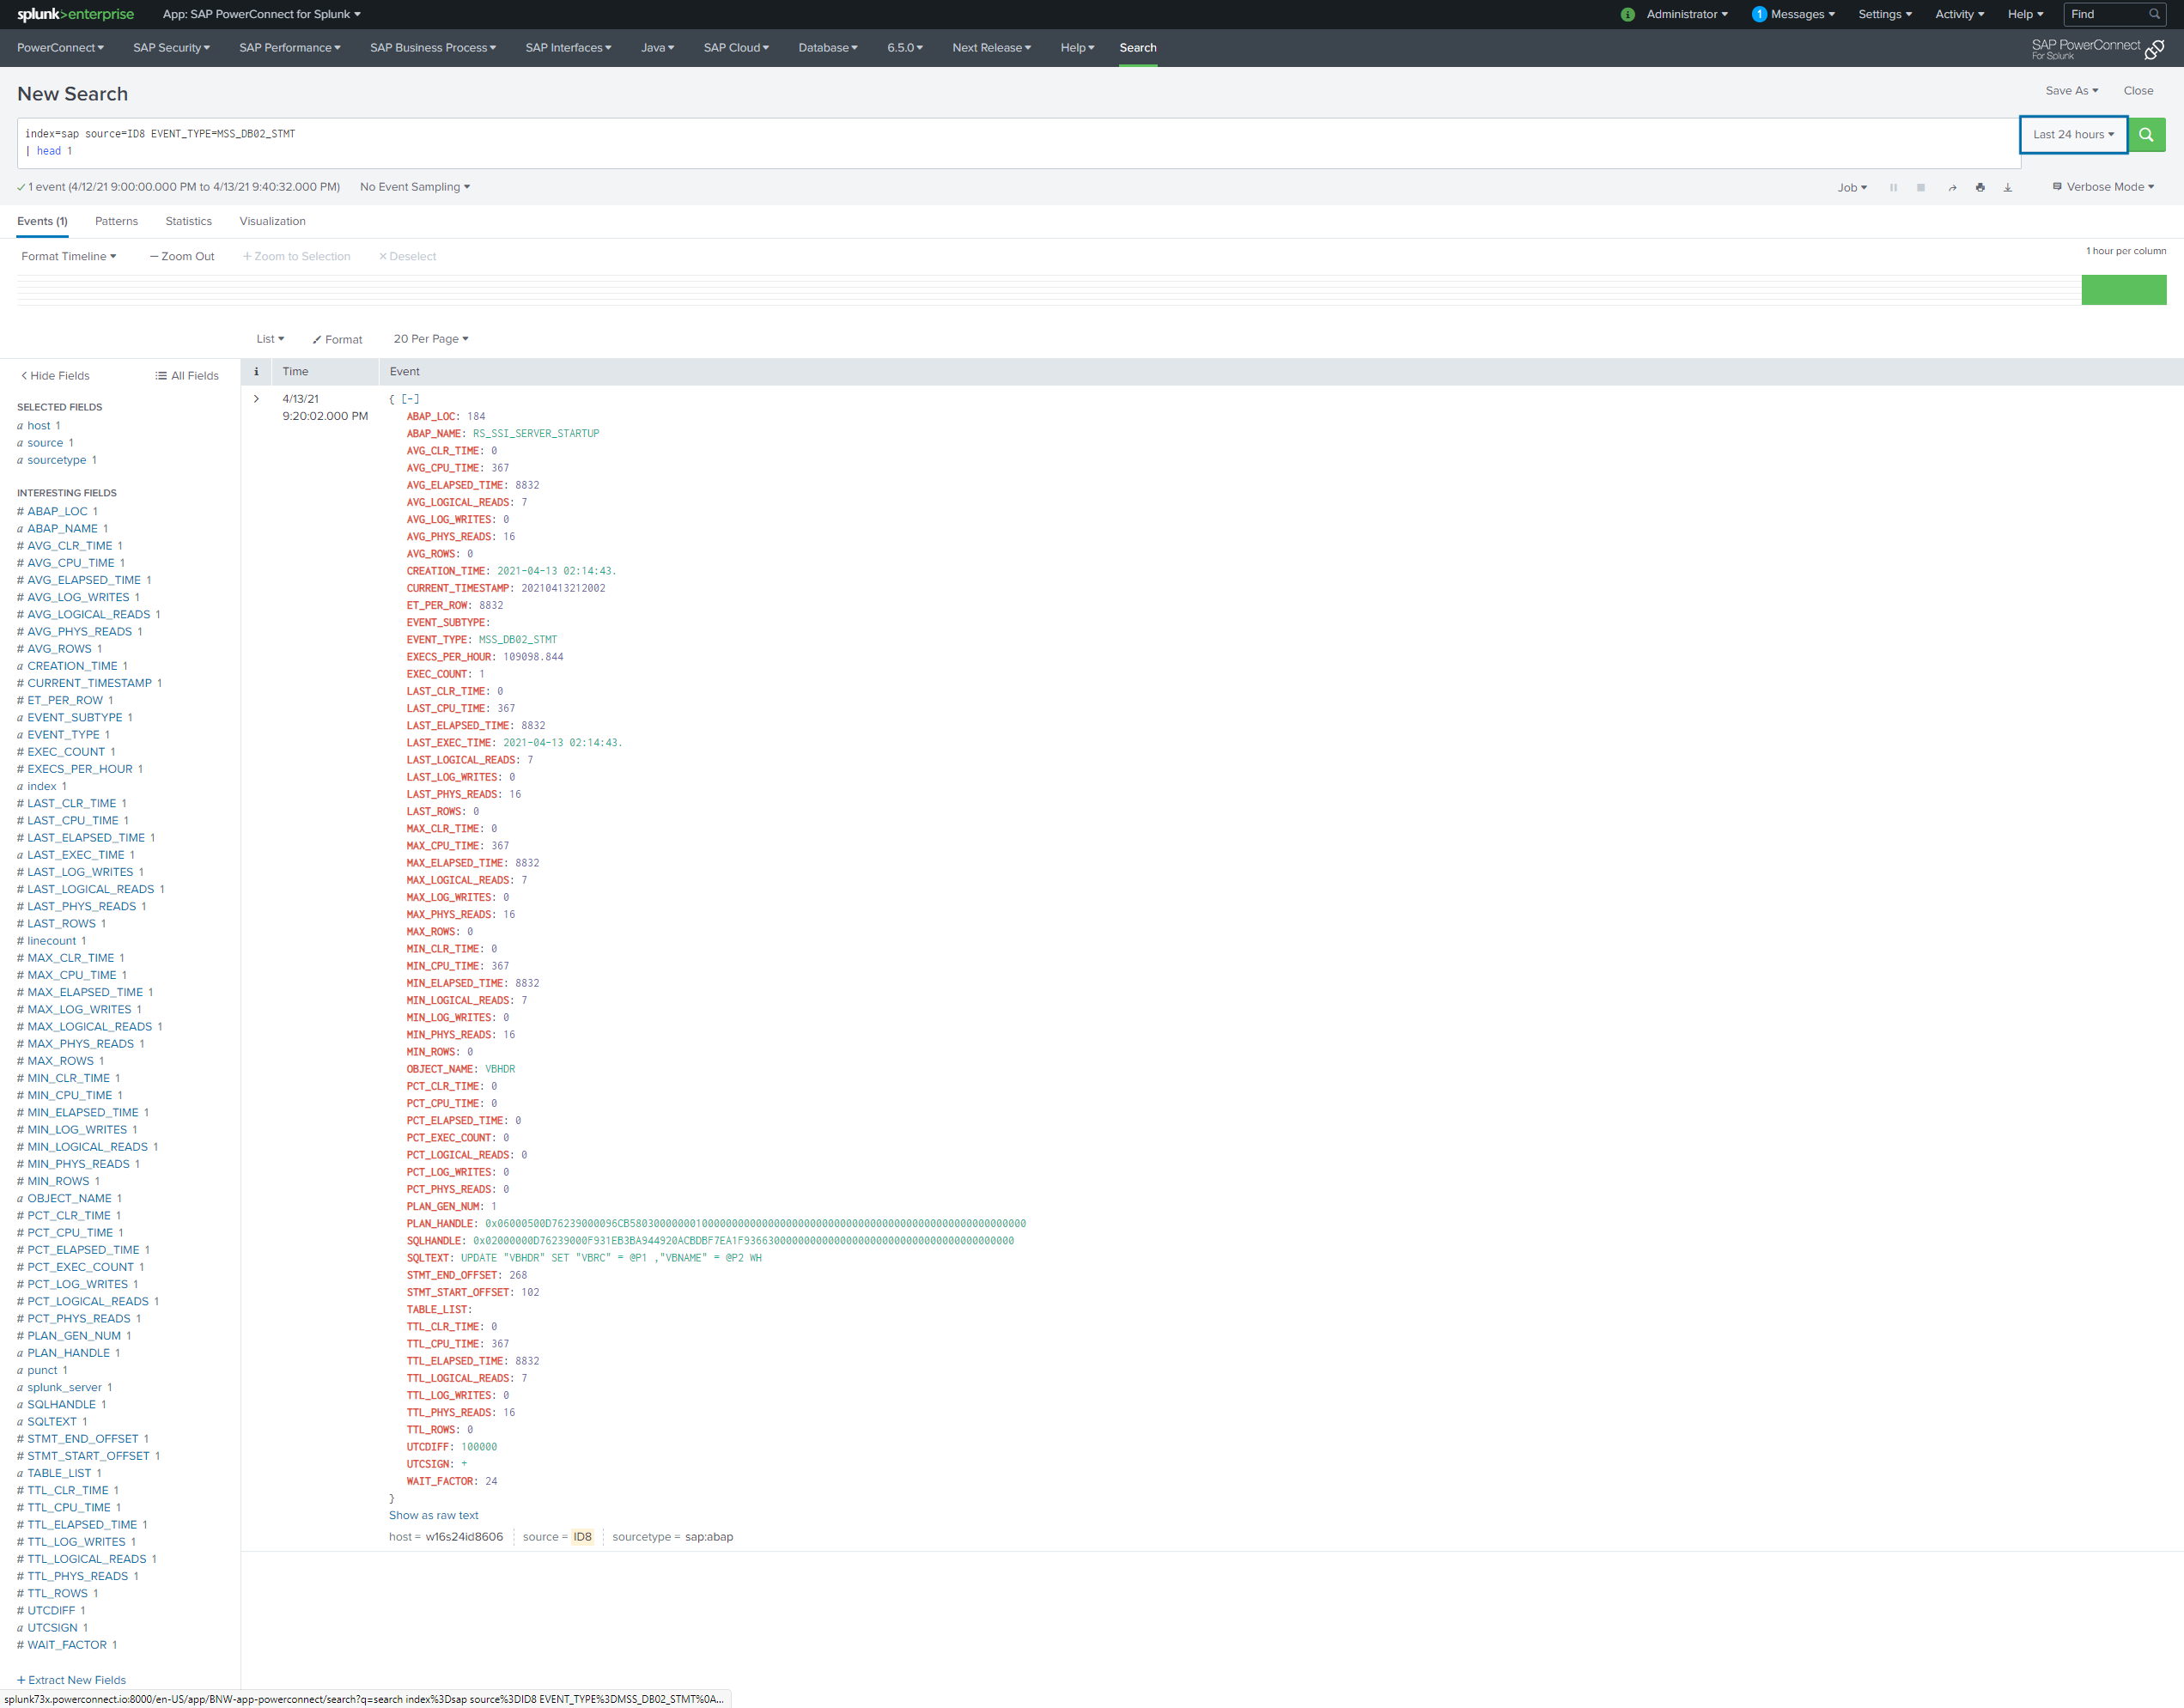
Splunk Event
The event will look like this in Splunk:
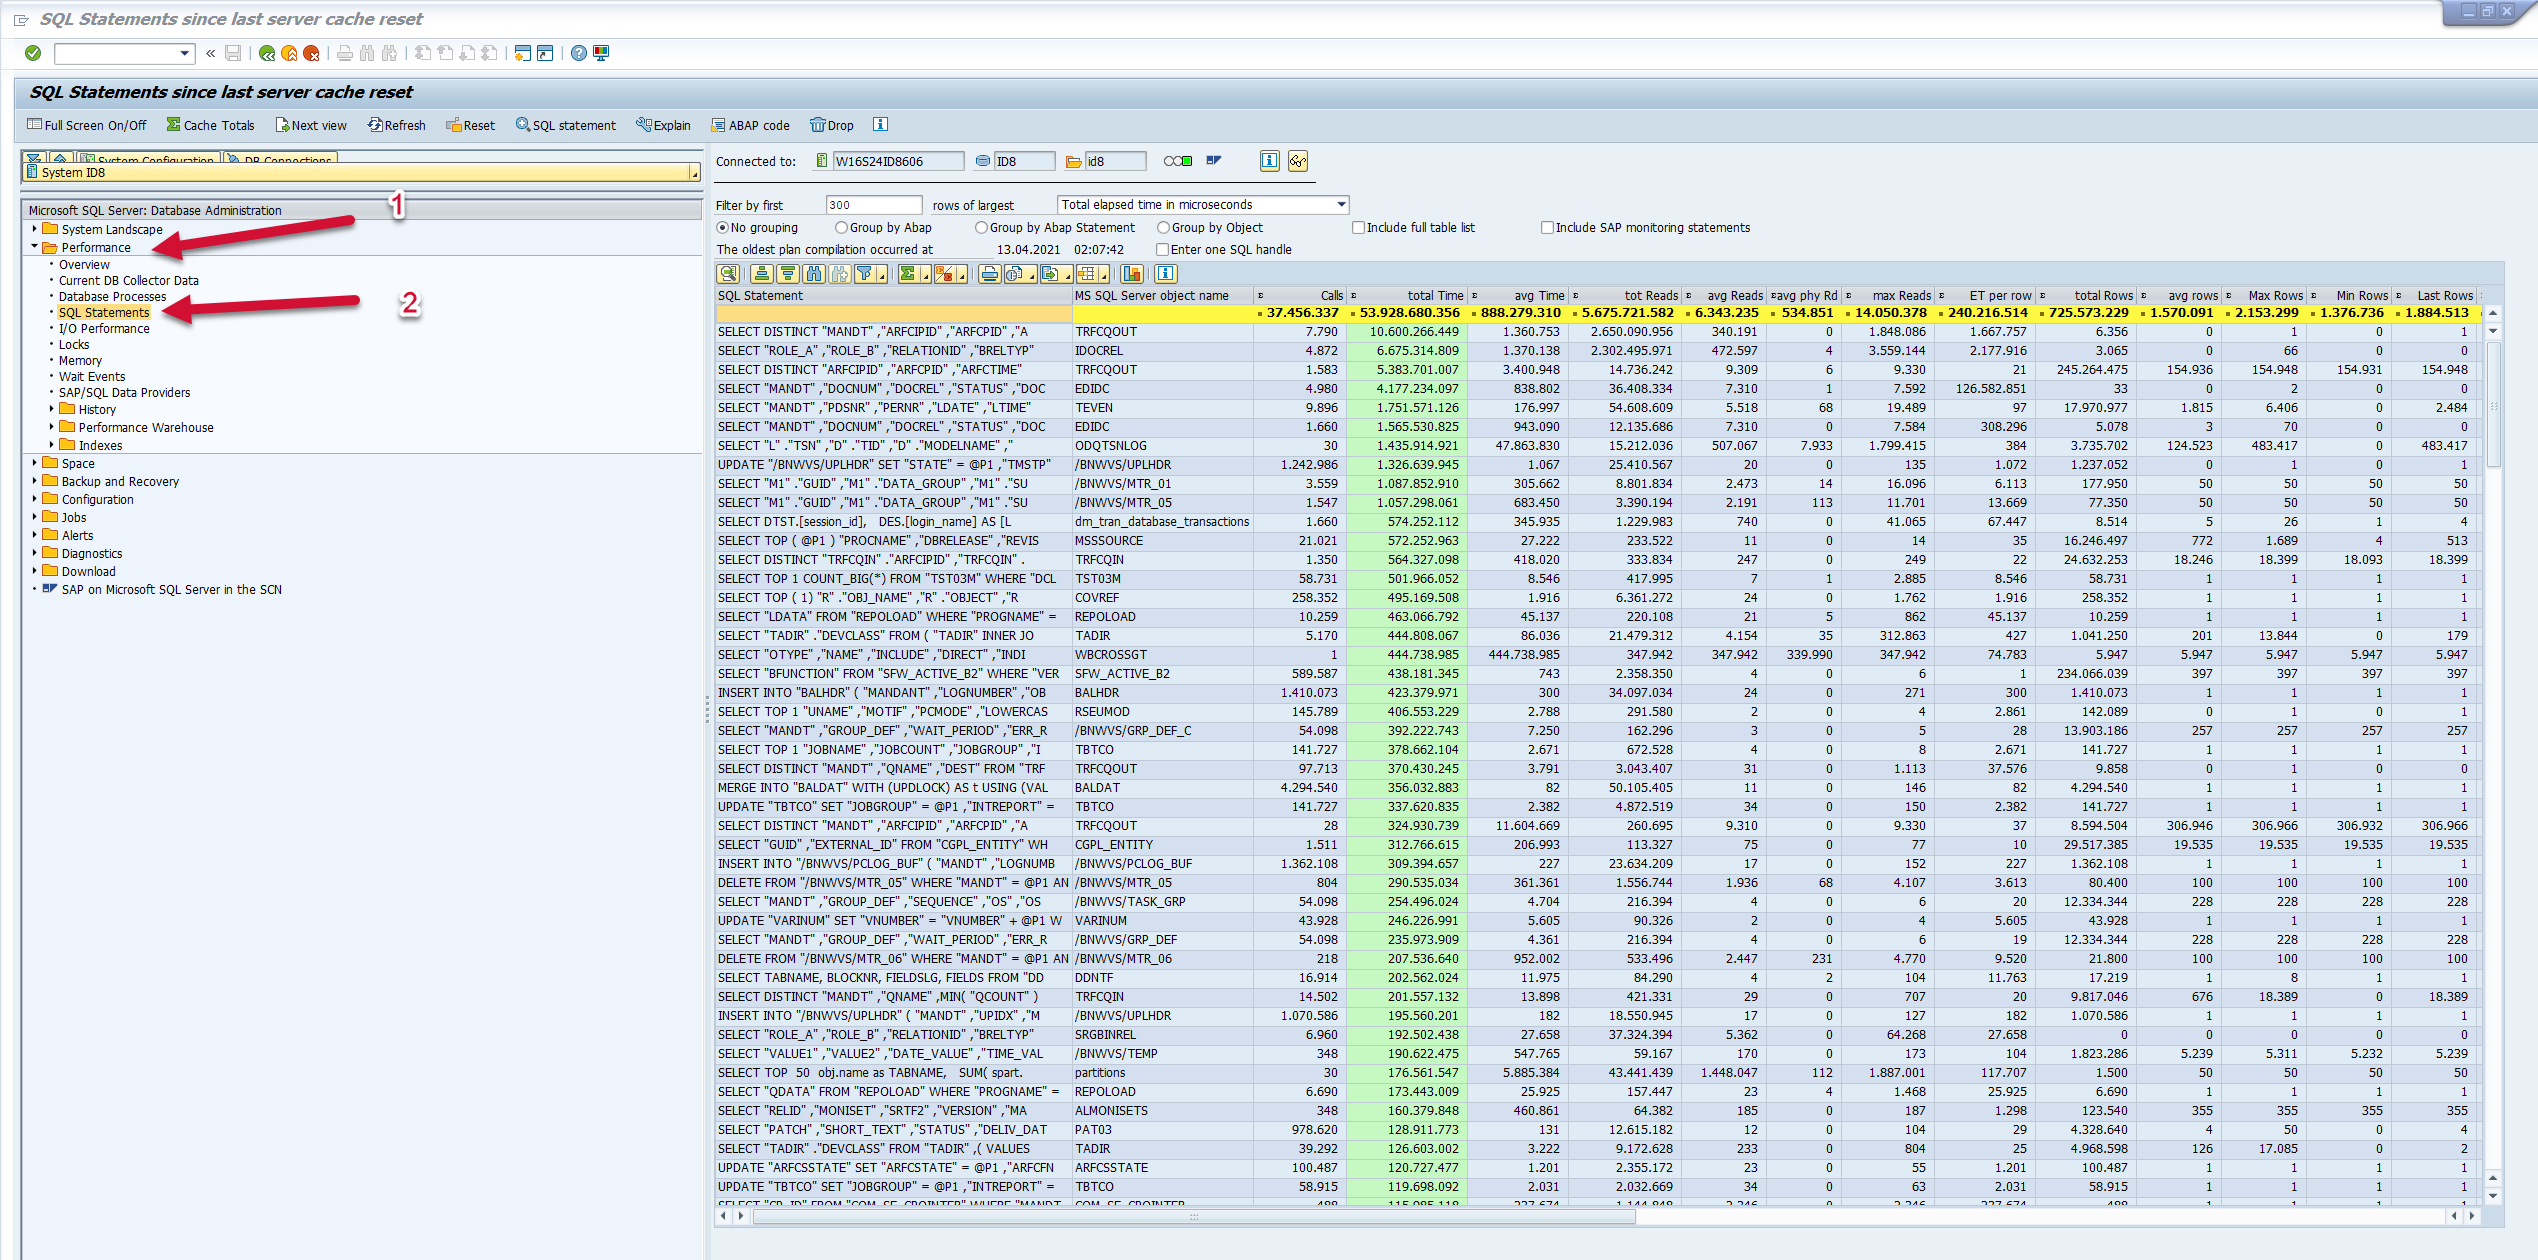
SAP Navigation
Log into the managed system and execute the dbacockpit transaction code. Then expand the Performance menu option, and double click the SQL Statements section. The data displayed on the page will match the data that is extracted and sent to Splunk.

Field Mapping
Field | Description | Unit of Measure |
---|---|---|
ABAP_LOC | Offset of a Processing Control Block | Number |
ABAP_NAME | Name of the ABAP report | String |
AVG_CLR_TIME | Average amount of CLR time consumed by this plan | Number |
AVG_CPU_TIME | Average amount of CPU time consumed by executions | Number |
AVG_ELAPSED_TIME | Average elapsed time in microseconds | Number |
AVG_LOGICAL_READS | Average logical reads for this plan since compiled | Number |
AVG_LOG_WRITES | Average logical writes for this plan since compiled | Number |
AVG_PHYS_READS | Average physical reads for this plan | Number |
AVG_ROWS | Average rows returned per execution | Number |
CREATION_TIME | MS SQL Server time at which the plan was compiled. | YYYY-MM-DD HH:MM:SS |
CURRENT_TIMESTAMP | The date time stamp when the information was collected | YYYYMMDDHHMMSS |
ET_PER_ROW | Elapsed time in microseconds per row | Number |
EVENT_SUBTYPE | String | |
EVENT_TYPE | MSS_DB02_STMT | String |
EXECS_PER_HOUR | Executions per hour | Number |
EXEC_COUNT | Number of plan executions since last compile | Number |
LAST_CLR_TIME | CLR time consumed by last execution of this plan | Number |
LAST_CPU_TIME | CPU time consumed by last execution of this plan | Number |
LAST_ELAPSED_TIME | Last elapsed time in microseconds | Number |
LAST_EXEC_TIME | MS SQL Server: Last time at which the plan was executed. | YYYY-MM-DD HH:MM:SS |
LAST_LOGICAL_READS | Last logical reads for this plan since compiled | Number |
LAST_LOG_WRITES | Total logical writes for this plan since compiled | Number |
LAST_PHYS_READS | Physical reads last time this plan executed | Number |
LAST_ROWS | Total number of rows returned for a query plan | Number |
MAX_CLR_TIME | Maximum CLR time consumed by this plan | Number |
MAX_CPU_TIME | Maximum CPU time consumed by this plan | Number |
MAX_ELAPSED_TIME | Maximum elapsed time in microseconds | Number |
MAX_LOGICAL_READS | Maximum number of logical reads this plan has ever performed | Number |
MAX_LOG_WRITES | Maximum logical writes for this plan for a single execution | Number |
MAX_PHYS_READS | Maximum number of physical reads for this plan | Number |
MAX_ROWS | Maximun number of rows returned for a query plan | Number |
MIN_CLR_TIME | Minimum CLR time consumed by this plan | Number |
MIN_CPU_TIME | Minimum CPU time consumed by this plan | Number |
MIN_ELAPSED_TIME | Minimum elapsed time in microseconds | Number |
MIN_LOGICAL_READS | Minimum number of logical reads this plan has ever performed | Number |
MIN_LOG_WRITES | Minimum logical writes for this plan for a single execution | Number |
MIN_PHYS_READS | Minimum number of physical reads for this plan | Number |
MIN_ROWS | Minimum number of rows returned for a query plan | Number |
OBJECT_NAME | MS SQL Server object name | String |
PCT_CLR_TIME | Percentage of overall CLR time | Number (Percent) |
PCT_CPU_TIME | Percent of total worker time | Number (Percent) |
PCT_ELAPSED_TIME | Percentage of all server elapsed times | Number (Percent) |
PCT_EXEC_COUNT | Percentage of server total execution counts | Number (Percent) |
PCT_LOGICAL_READS | Percent of server wide logical reads | Number (Percent) |
PCT_LOG_WRITES | Percentage of all logical writes | Number (Percent) |
PCT_PHYS_READS | Percent of all physical reads | Number (Percent) |
PLAN_GEN_NUM | Number of times this plan has been recompiled | Number |
PLAN_HANDLE | handle pointing to plan used in execution of sql stmt/proc | Integer |
SQLHANDLE | handle pointing to sql statment or procedure | Integer |
SQLTEXT | First 50 characters of a SQL Server statement | String |
STMT_END_OFFSET | Statement end offset | Number |
STMT_START_OFFSET | Start statement offset | Number |
TABLE_LIST | Comma separated table list | String |
TTL_CLR_TIME | Total amount of CLR time consumed by executions of this plan | Number |
TTL_CPU_TIME | Total amount of CPU time consumed by executions of this plan | Number |
TTL_ELAPSED_TIME | Total elapsed time in microseconds | Number |
TTL_LOGICAL_READS | Total logical reads for this plan since compiled | Number |
TTL_LOG_WRITES | Total logical writes for this plan since compiled | Number |
TTL_PHYS_READS | Total physical reads for this plan | Number |
TTL_ROWS | Total rows for this plan | Number |
UTCDIFF | The UTC OFFSSET in HHMMSS that the data was collected in | HHMMSS |
UTCSIGN | The UTC positive or negative OFFSET indicator. Positive (+) means add UTCDIFF to find the time zone of the data, negative (-) means subtract the UTCDIFF to find the time zone adjusted date time the data was collected in. | + | - |
WAIT_FACTOR | Elapsed time/CPU time | Number |