ABAP Troubleshooting
Summary
Please consult the Knowledge Base to see if the problem you are encountering is documented with a resolution. The document below outlines key information required to troubleshoot potential problems associated with the PowerConnect ABAP application. Please acquire and attach the information below when submitting a support incident. Potential scenarios include:
Dumps associated with the PowerConnect application.
PowerConnect batch jobs failures.
PowerConnect metric uploader, check job, or data collector jobs are deactivated.
Expected data was not collected.
Errors in the PowerConnect administrative console.
Delays in data reaching Splunk.
Mandatory Information for PowerConnect ABAP Support Incidents
PowerConnect Troubleshooting Logs
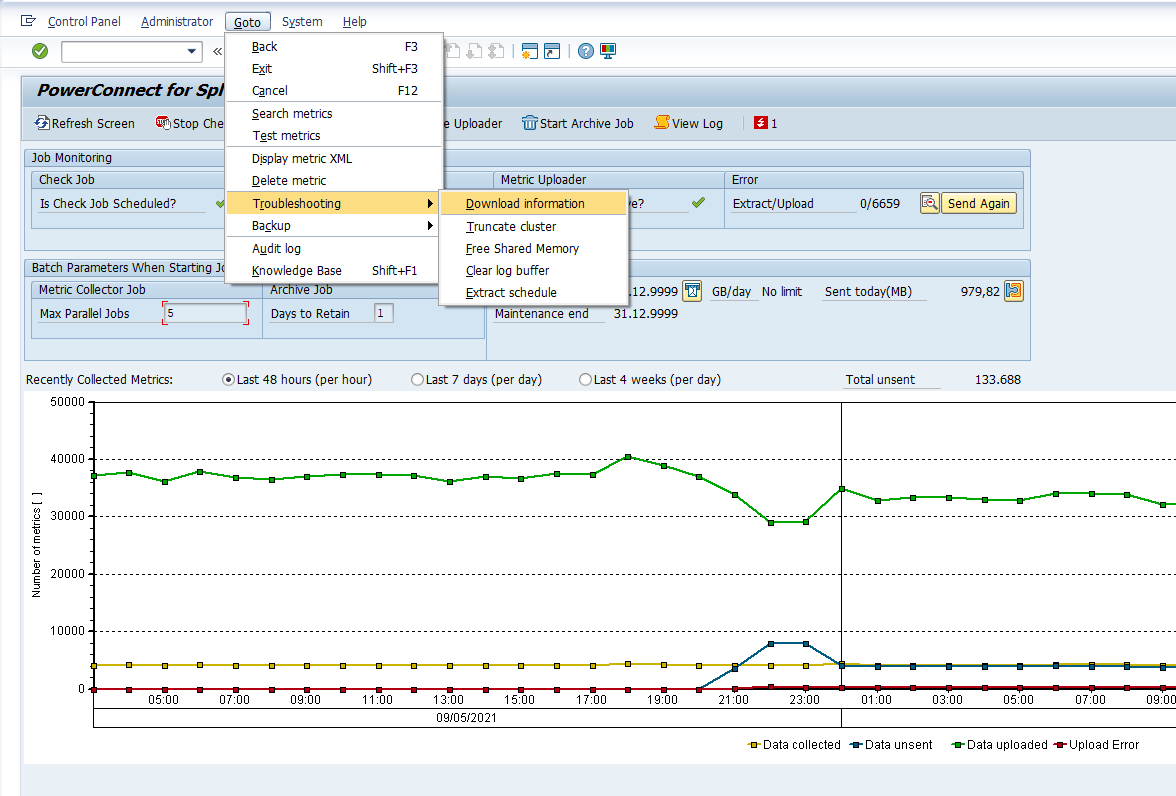
Starting from PowerConnect SP 6.00 it is possible to extract PowerConnect troubleshooting information to provide the support team with additional details and context. Please ensure these logs are sent as part of any PowerConnect support incident. To access the troubleshooting information, log into the managed system and execute the /n/bnwvs/main transaction. Then go to Goto → Troubleshooting → Download Information
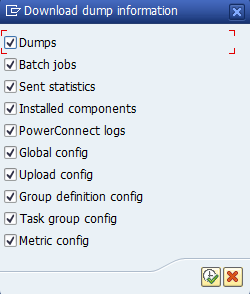
Once necessary options are confirmed (all options are selected by default), you will be given a file save dialog. The data is saved as compressed ZIP archive, which could be easily attached to the email/ticket.
Procedures - ABAP System
No Data is Being Sent to Splunk Because PowerConnect Batch Jobs are Disabled
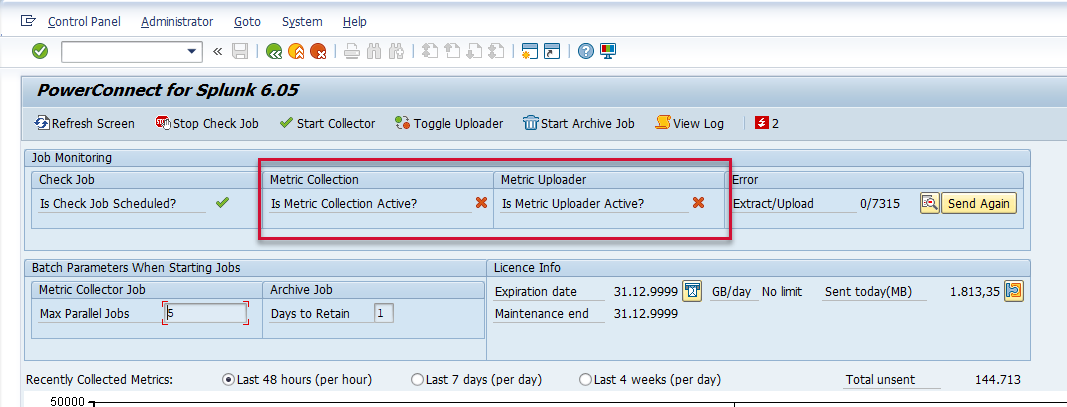
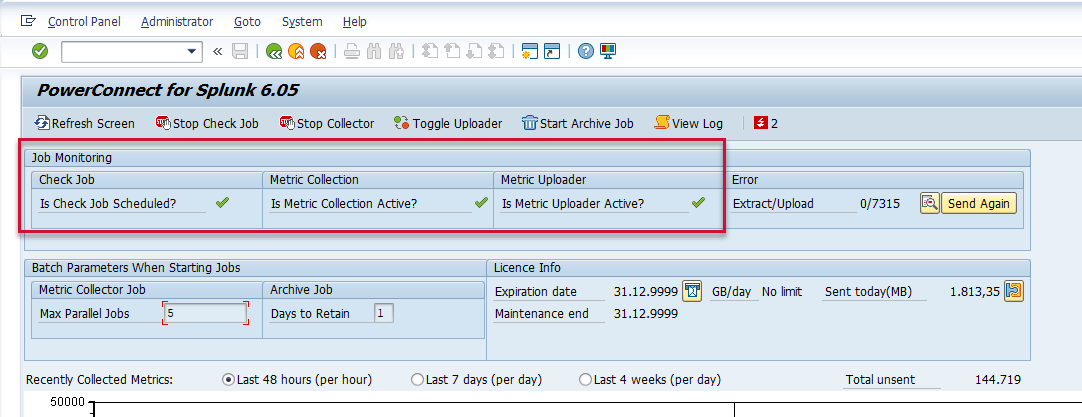
If there is no data being sent to Splunk, the first item to check is to determine if PowerConnect batch jobs are disabled. To determine this, log into the managed system, and execute the /n/bnwvs/main transaction. Then confirm that all three jobs have a green check box next to their name.

If one or more of the batch jobs are disabled, a red checkbox will be displayed:
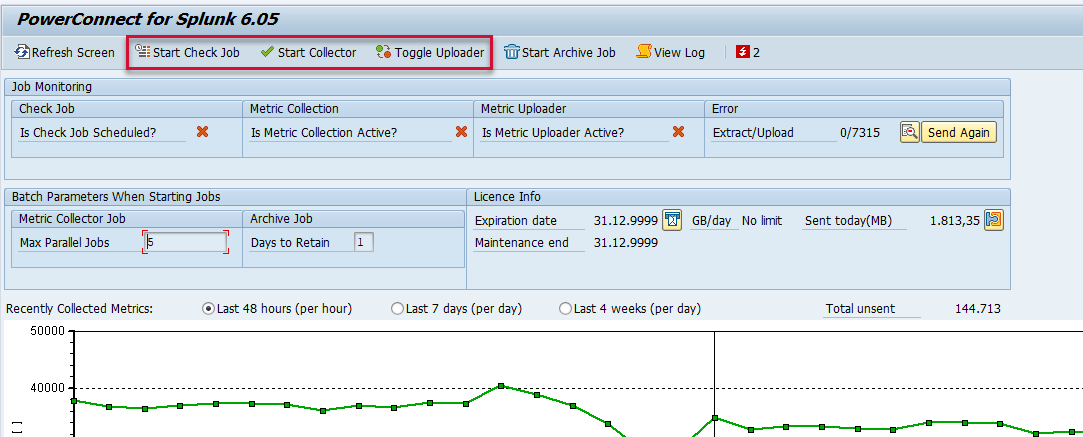
To restart the jobs, select the corresponding button to restart the job, and input the username responsible for executing the PowerConnect batch job.
Refresh the screen after several minutes and confirm that all the checkboxes are displaying green. Then check confirm data is visible in Splunk.
Data for Particular Extractor is Not Visible in Splunk
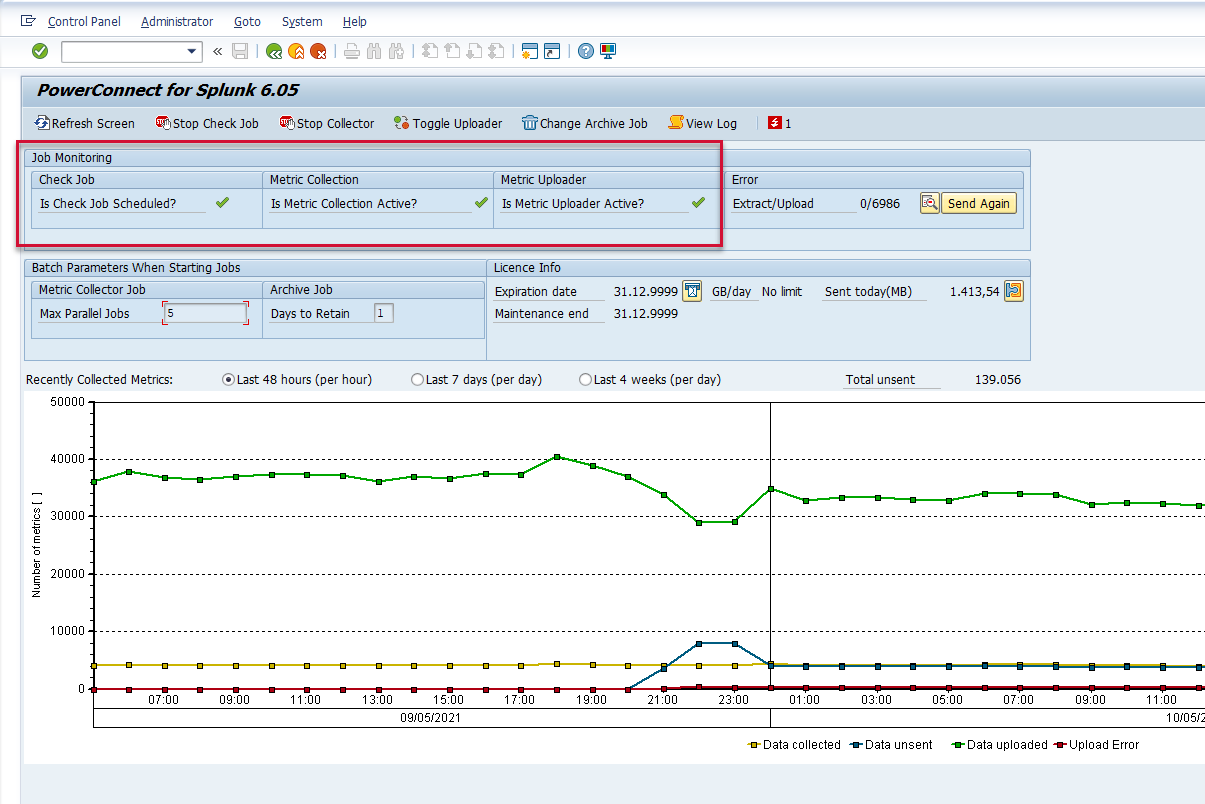
The first step is to review the Group Definition configuration in the system where you cannot see the data to confirm it is active. Complete these steps by logging into the managed system in SAP, and executing the /n/bnwvs/main transaction. Confirm that the three batch jobs are activated (green check boxes). If the jobs are deactivated, reactivate them, and check in Splunk in accordance with the interval defined for the extractor (see below for how to obtain this information).
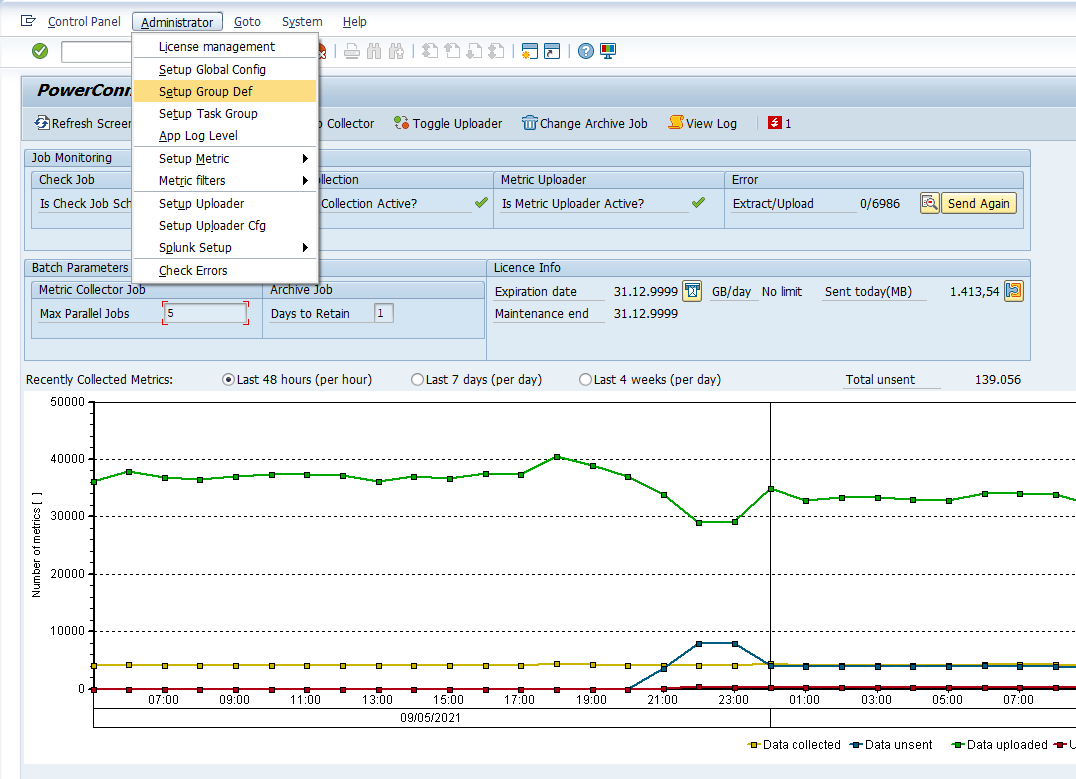
Then go to Administrator → Setup Group Def.
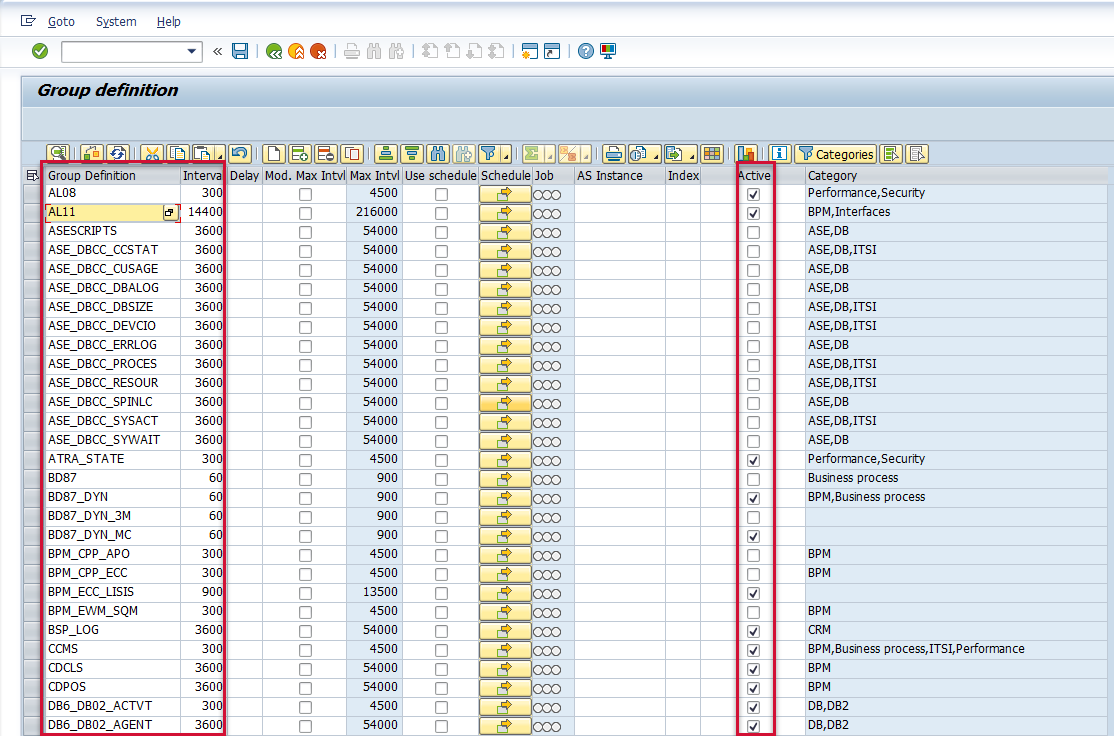
Confirm that the Active box is checked next to the extractor for which you are missing data, and that your Splunk search parameters align with the interval defined in the Group Def configuration.
Metric Errors in the PowerConnect Administrative Console
If there are metric errors in the PowerConnect Administrative Console they will be visible by logging into the managed system and executing the /n/bnwvs/main transaction. If there are metric errors, there will be statistics visible in the following section of the administrative console.
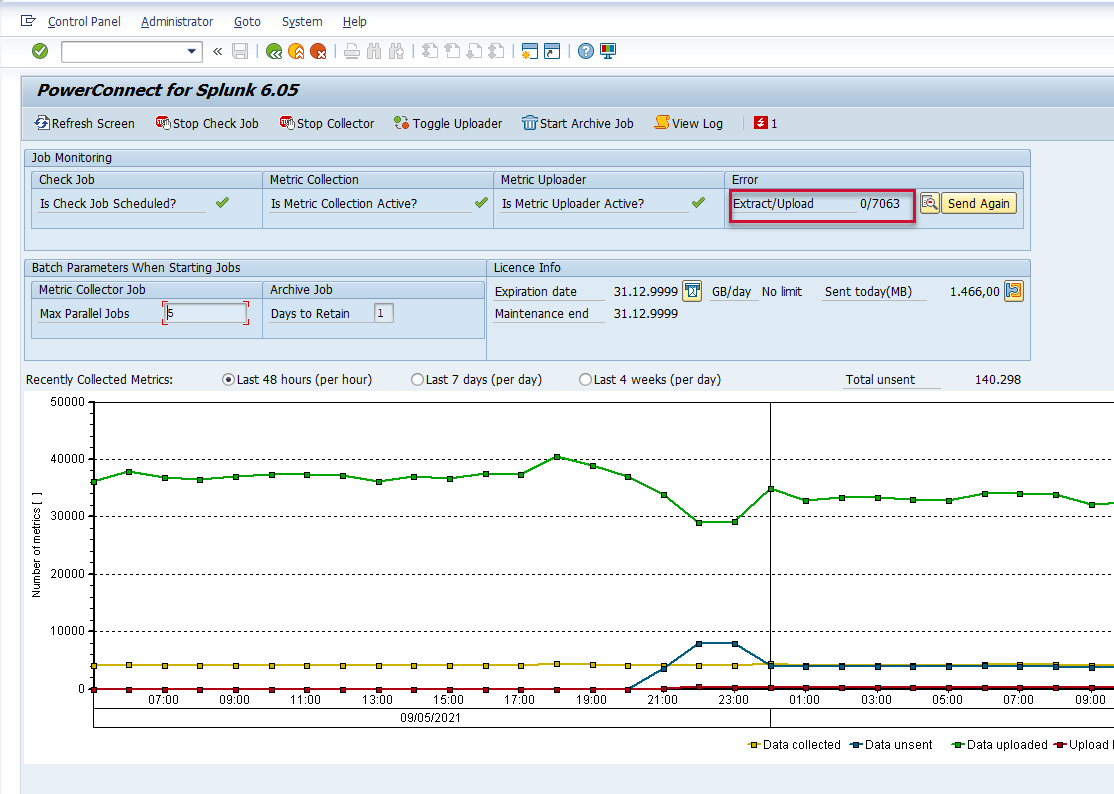
In case of metric errors, extract the PowerConnect Troubleshooting Logs (see “PowerConnect Troubleshooting Logs”) and attach them to the support incident.
PowerConnect ABAP Dumps
If there are dumps associated with the PowerConnect application they will be visible in the ST22 transaction. Additionally, you can view if there are PowerConnect dumps in the PowerConnect Administrative Console by logging into the managed system and executing the /n/bnwvs/main transaction. Then click on the following icon in the top right side of the screen:
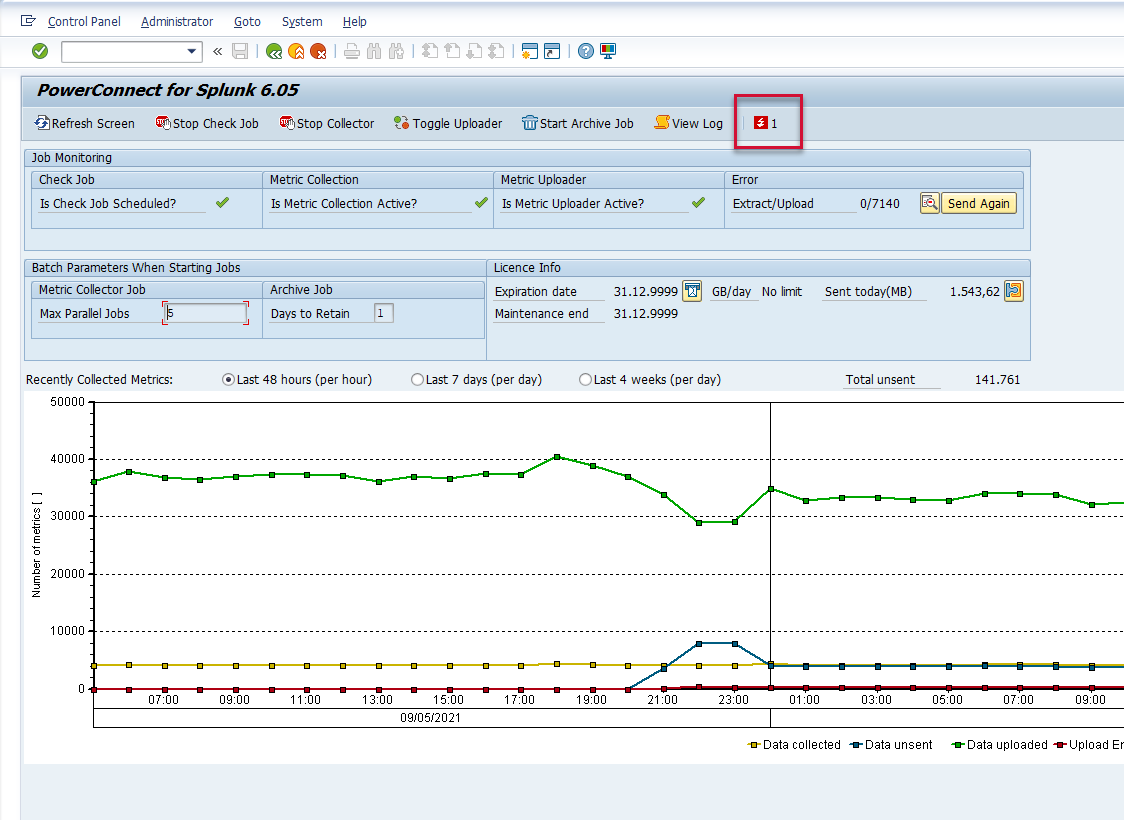
If there are dumps visible, the icon associated with Dumps will be red. If you wish to view the dumps, click on the Details icon.
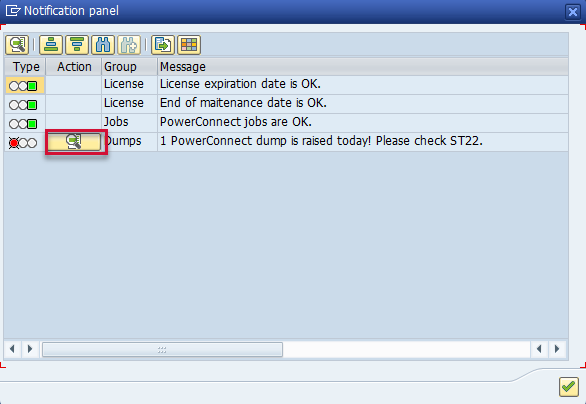
If you find there are dumps associated with the PowerConnect application please extract the PowerConnect Troubleshooting Logs (see “PowerConnect Troubleshooting Logs”) and attach them to the support incident.
PowerConnect Batch Job Failures
If there are batch job failures associated with the PowerConnect application they will be visible in the SM37 transaction. Additionally, you can view if there are PowerConnect batch job failures in the PowerConnect Administrative Console by logging into the managed system and executing the /n/bnwvs/main transaction. Then click on the following icon in the top right side of the screen:

If there are batch job failures, the icon associated with Jobs will be red. If you wish to view the batch job failures, click on the Details icon.
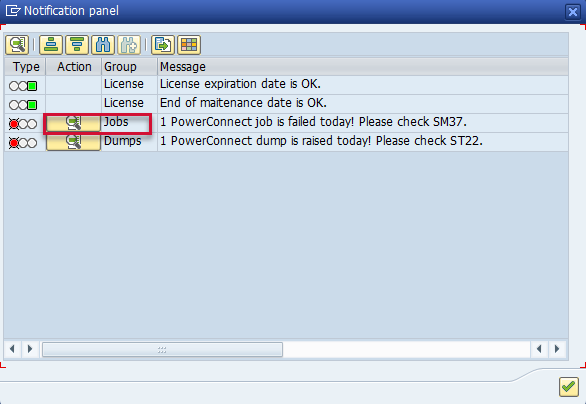
Highlight the batch job of interest, and then select the Job Log button.

In some instances you will see if the batch job failed because of a ST22 dump or because of another cause. If the job log references an ST22 dump please see the “PowerConnect ABAP Dumps” section mentioned above. If you see something similar to the screenshot below which references the system log, please continue onwards. Please take a screenshot for future reference.

Go back to the SM37 summary screen, and select the Change Layout button.

Add the Executing server, End date, End time, and Work process number to the layout.
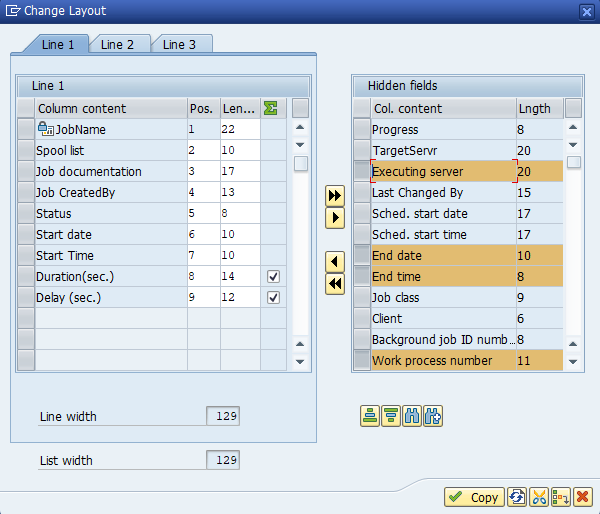
Export the information displayed to be submitted with the support incident, and write down the Executing server, End date, End time, and Work process number for future reference.

Execute the SM51 transaction, and double-click on the server name referenced from the SM37 data.

Reference the work process number noted from the SM37 data and highlight the row associated with that number. Then from the top menu go to Administration → Trace → Display File → Current
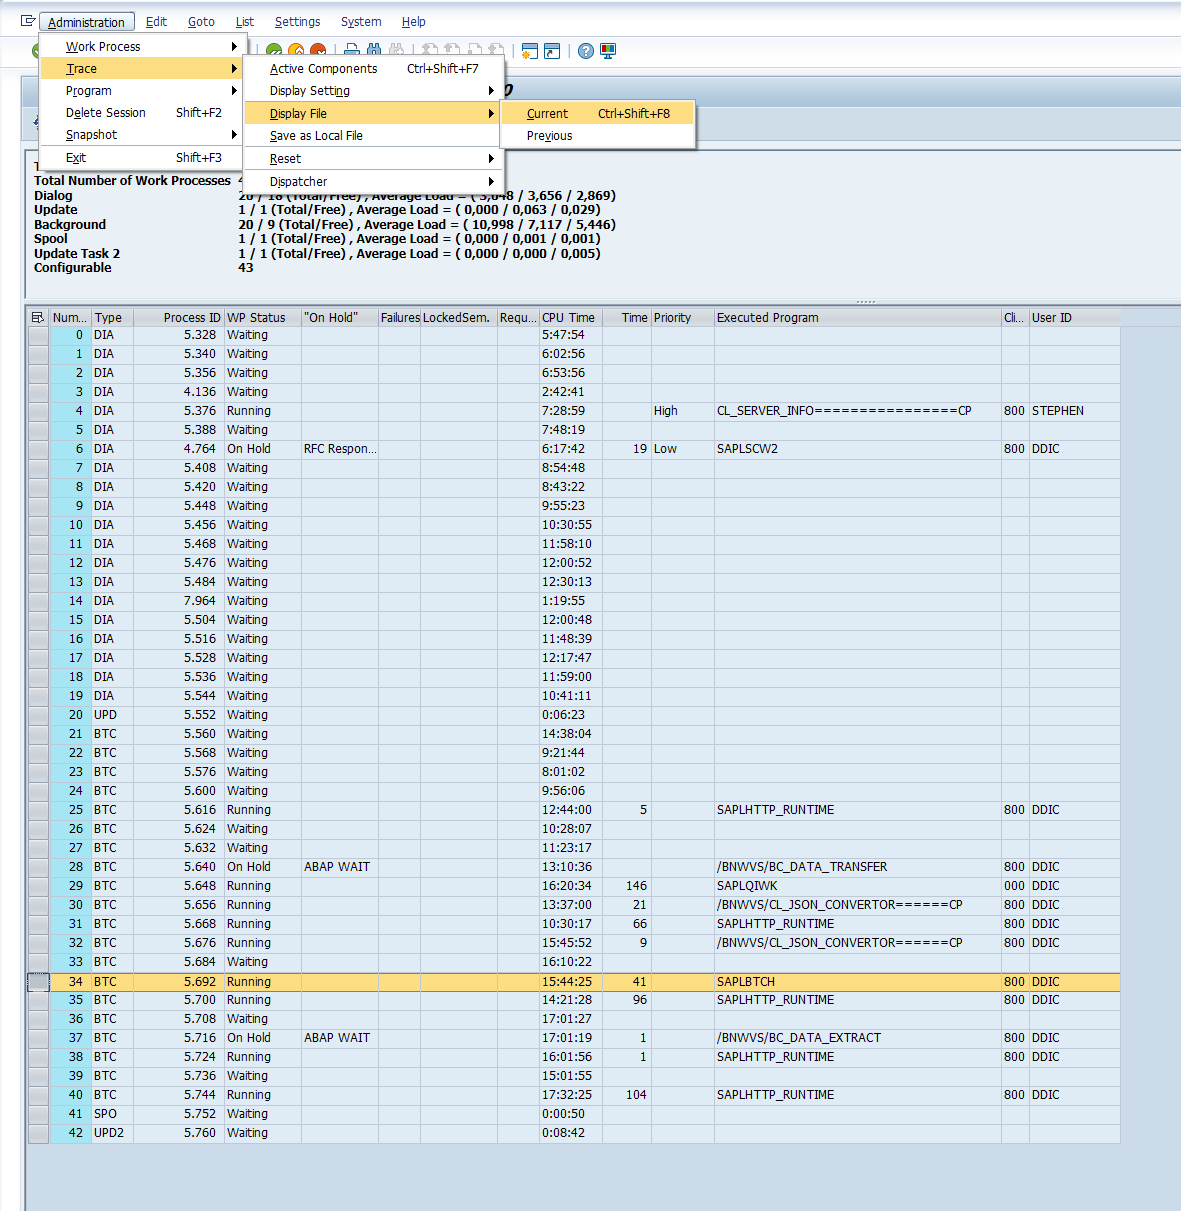
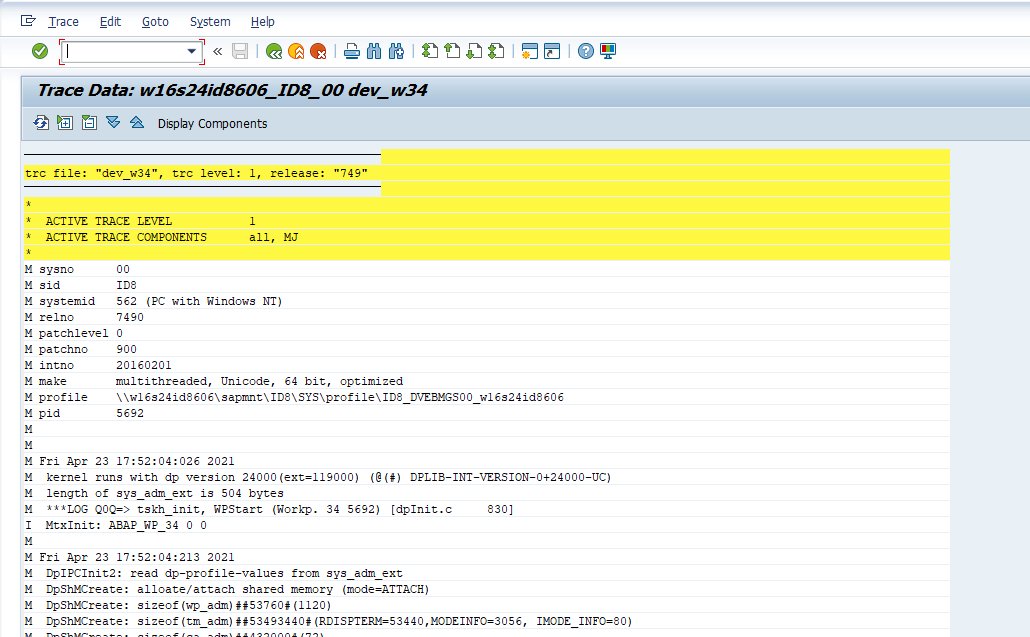
Export the data referenced in the screen below in a .txt format, and attach it to the support incident along with the PowerConnect Troubleshooting Logs (see PowerConnect Troubleshooting Logs), the SM37 batch job view referenced earlier, and a screenshot of the SM37 job log.
Procedures - Splunk System
Data for Particular Extractor is Not Visible in Splunk
The first step in this case is to check with the SAP team to review the Group Definition configuration in the system where you cannot see the data to confirm it is active. Please review the section above titled “Data for Particular Extractor is Not Visible in Splunk” in the “Procedures - ABAP System” section. If for some reason, you do not have access to the SAP system, please access the Extractor Status dashboard, made available during the Splunkbase App 6.2 release. This dashboard can be accessed by going to the PowerConnect App in your Splunk instance. Then select PowerConnect → Extractor Status.

You will be brought to the dashboard below. Enter the time where the data was not collected and the system impacted in the user selection parameters. If the extractor is not activated, ask the team responsible for the administration of the PowerConnect admin tool in SAP to activate the extractor based on your requirements. Otherwise, export the information to Excel and attach it to the support incident.

Delays in SAP Data Reaching Splunk
If there are instances in which the data is not reaching Splunk at the interval defined in the Group Definition section of the PowerConnect administrative console please perform the following searches in your Splunk environment. Perform this search over the time period, during which the service was disrupted. Export these results in an Excel format and attach them to the support incident along with a screenshot of the graphs.
Metrics in PowerConnect To Send Queue
index=<index> source=<source> EVENT_TYPE=PC_HEALTH
| timechart span=5m max(TOTAL_TO_SEND)
Count of PowerConect Errors Over Time
index=<index> source=<source> EVENT_TYPE=PC_HEALTH
| timechart span=5m max(IN_ERROR)
Delays in Data Reaching Splunk for a Specific Event Type
index=<index> source=<source> EVENT_TYPE=<EVENT_TYPE>
| fields _indextime CURRENT_TIMESTAMP
| eval indextime=_indextime
| eval indextime_human_readable=strftime(indextime,"%m/%d/%Y %H:%M:%S")
| eval Data_Extraction_Time_Epoch=strptime(CURRENT_TIMESTAMP,"%Y%m%d%H%M%S")
| eval Data_Extraction_Time=strftime(Data_Extraction_Time_Epoch,"%m/%d/%Y %H:%M:%S")
| eval difference=round(indextime-Data_Extraction_Time_Epoch,0)
| rename Data_Extraction_Time as "Time Data Extracted in PowerConect", indextime_human_readable as "Time Data Indexed by Splunk", difference as "Difference Between Index Time and Time Data Extracted in PowerConnect (s)"
| table "Time Data Indexed by Splunk" "Time Data Extracted in PowerConect" "Difference Between Index Time and Time Data Extracted in PowerConnect (s)"
