Configuring a Dynatrace Connection in PowerConnect for SAP Data Services
Configuration Steps
To create a connection to the Dynatrace Log Monitoring API do the following:
Open the PowerConnect Java UI - http(s)://<cmc-host>:<port>/powerconnect-java/index.html
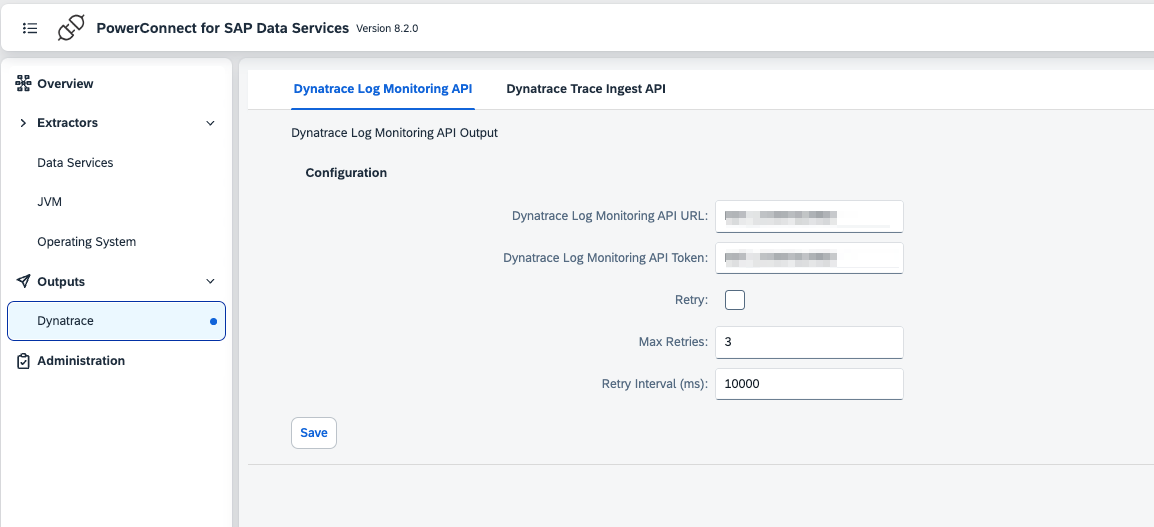
On the menu on the left click Dynatrace under Outputs
Fill in the details of your Dynatrace Log Monitoring API endpoint:

Configuration | Description | Required | Default Value | Comments |
|---|---|---|---|---|
Dynatrace Log Monitoring API URL | Log Monitoring API url | Yes |
| |
Dynatrace Log Monitoring API Token | Log Monitoring API token | Yes |
|
|
Retry | Retry sending data if the Dynatrace endpoint is down | No | No |
|
Max Retries | If retries are enabled defines how many times the Agent will retry before giving up | No | 3 |
|
Retry Interval | Time in milliseconds the Agent will wait between retries | No | 10000 |
|
Click Save
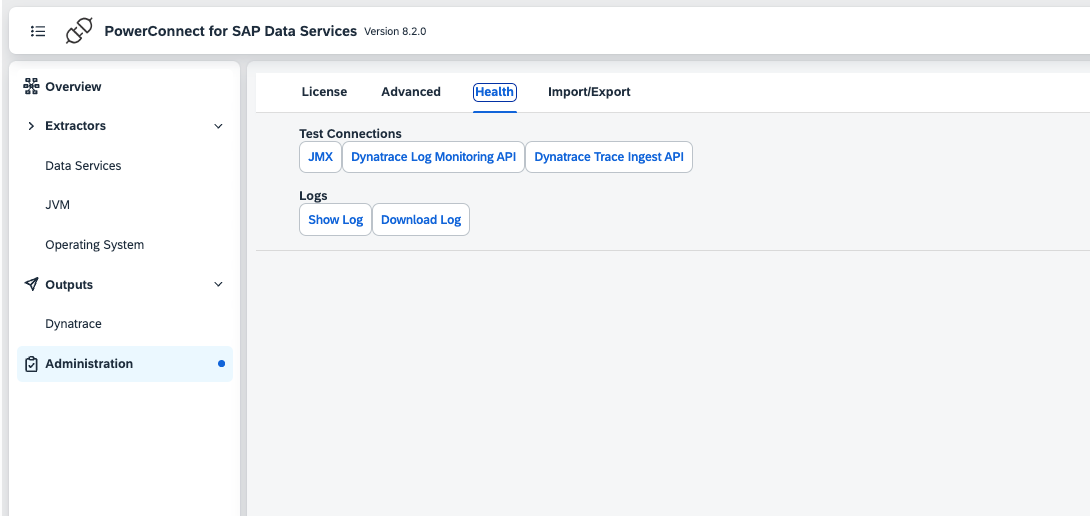
To test the connection click Administration in the menu on the left then click the Health tab

Click the Dynatrace Log Monitoring API button and a message will be displayed showing the result

