GW_ERROR_FND - SAP Gateway Frontend Error Log
Data Description
The GW_ERROR_FND event (corresponding to SAP transaction /IWFND/ERROR_LOG for hub system) is used to obtain important detailed context information about the time and location of SAP Gateway frontend errors that have occurred at run time.
Potential Use Cases
This event could be used in the following scenarios:
Alert on specific error messages displayed in the error log
Correlate Gateway Front end errors with other occurrences in the environment such as Gateway backend errors
Determine error trends over time
Identify precise time and location of errors in source code
Perform root-cause analyses
Reproduce and correct errors
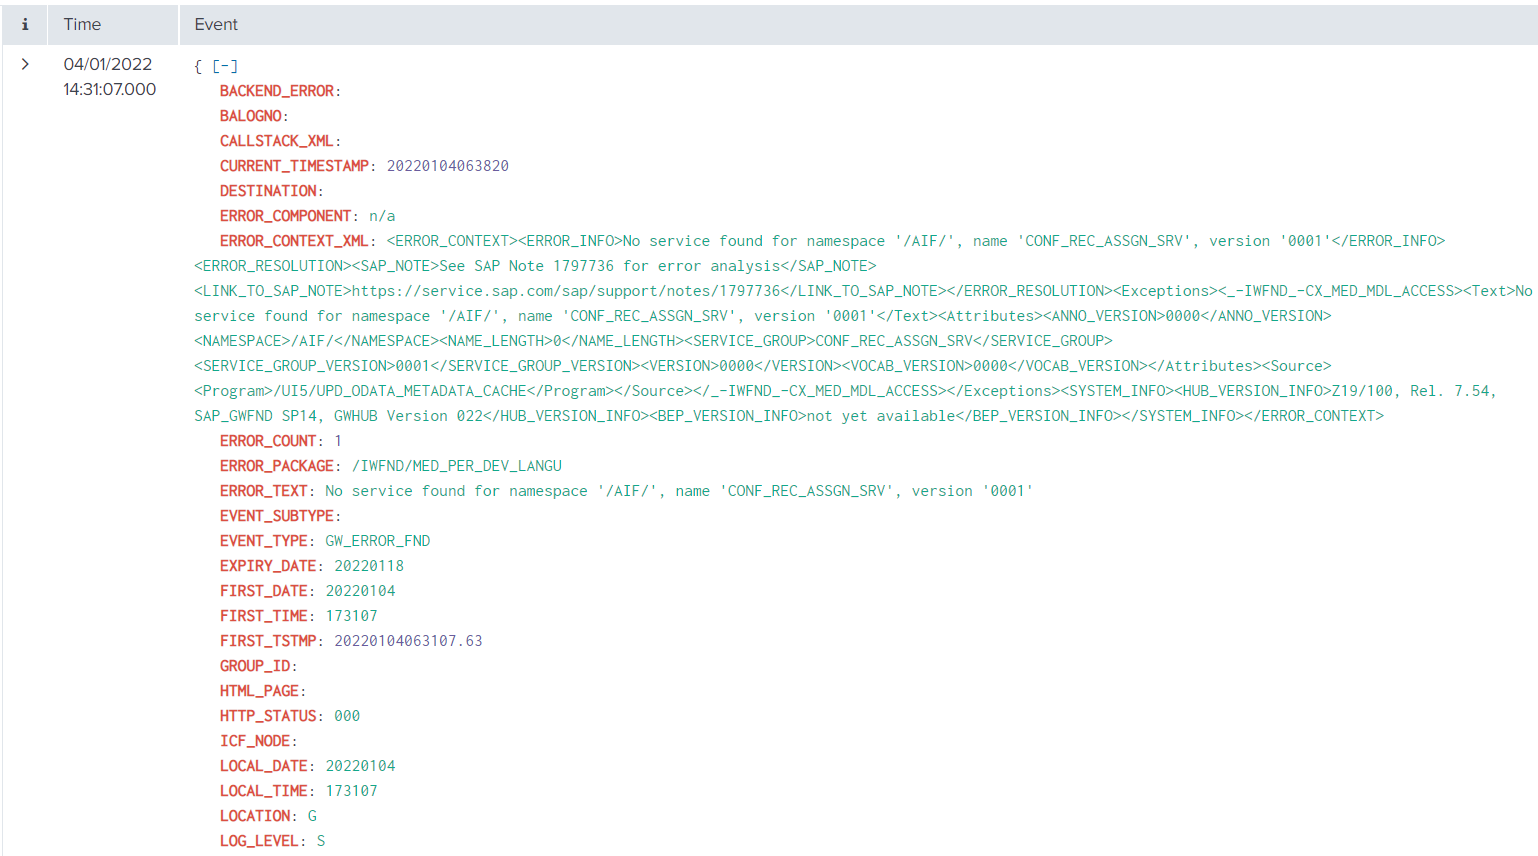
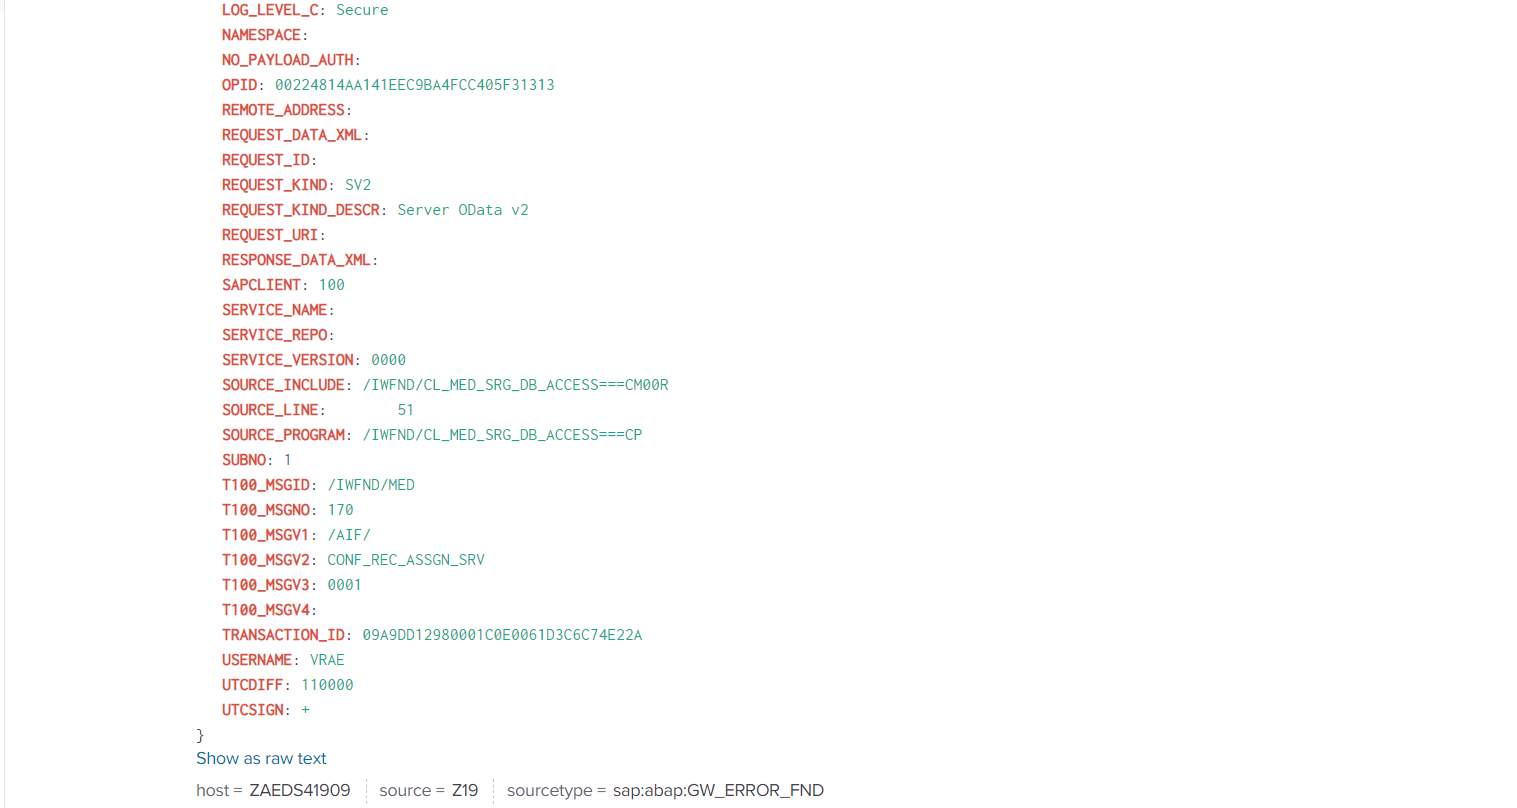
Splunk Event
The event will look like this in Splunk:


SAP Navigation
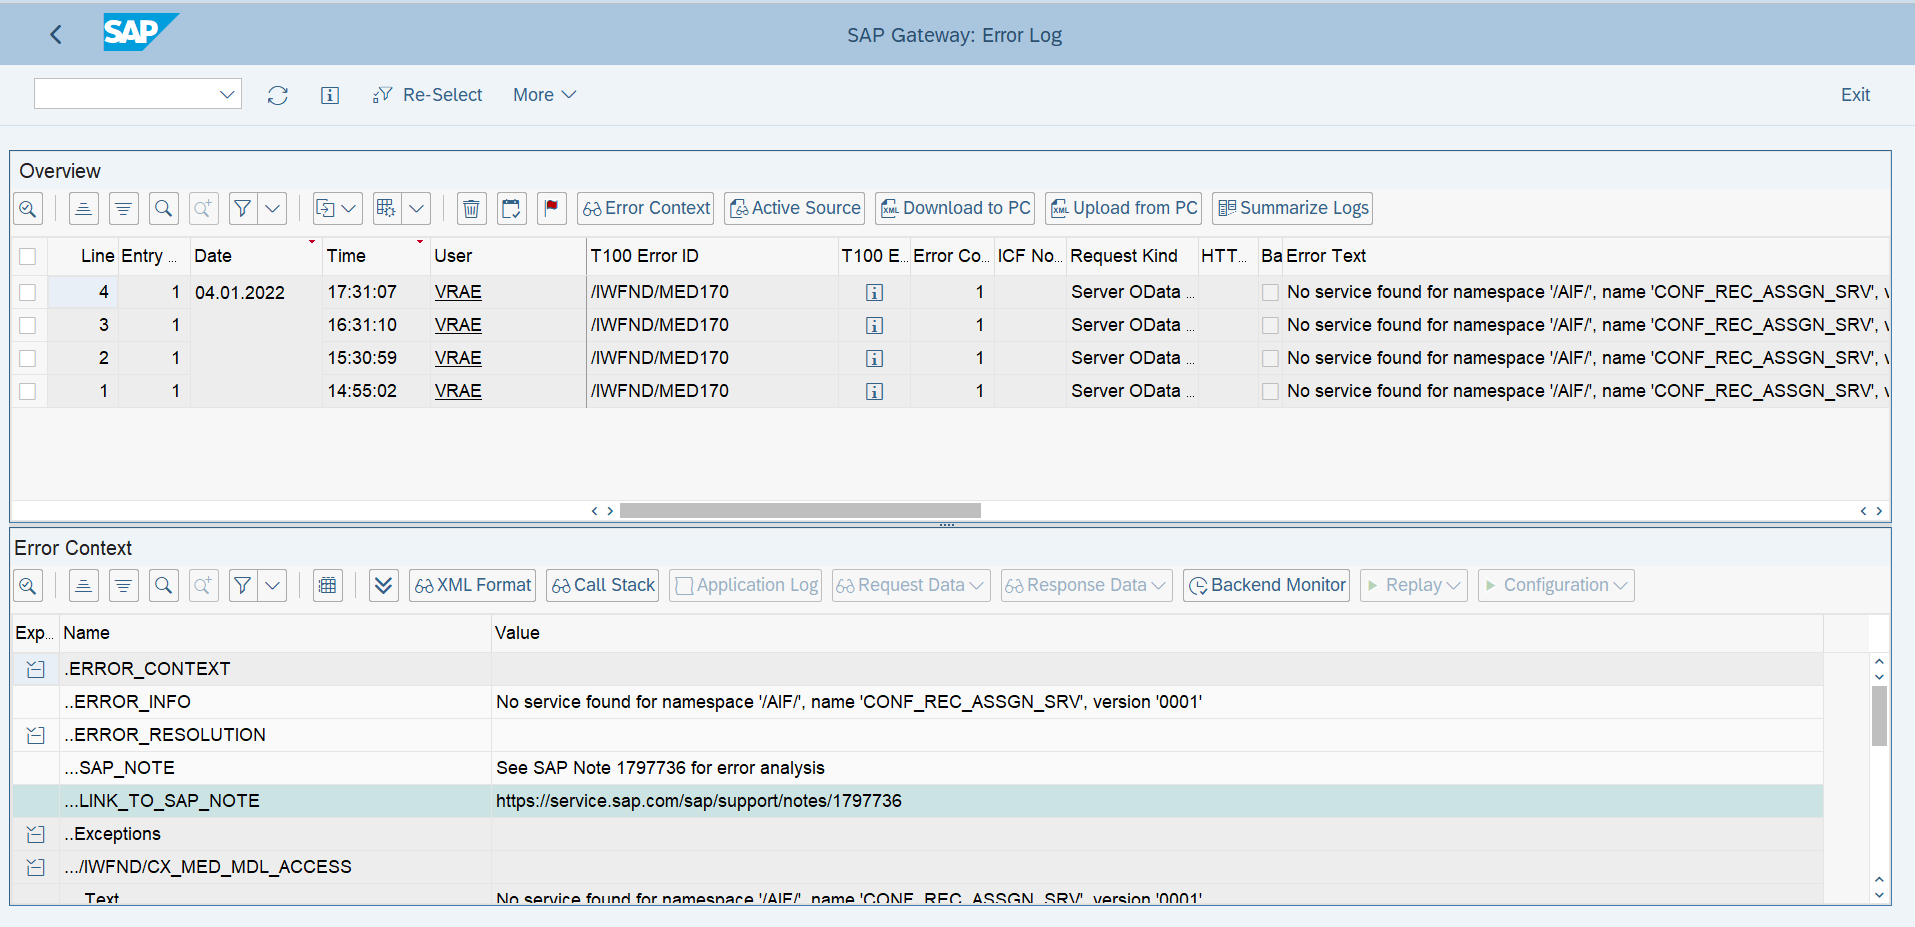
Log in to the SAP system and execute the /IWFND/ERROR_LOG transaction code. The SAP Gateway error logs will be displayed if present.

The Error Log comprises two screen areas:
Overview: All the data of overview screen are available to Splunk
Error Context: The Error Context screen area includes the following functions, which can be executed by choosing the relevant pushbuttons.
Error Context(XML Format)
Display error in the context in XML format.
Call Stack
Display call stack up to the source code line in which the error occurred.
Request Data
Display request XML that was sent from external consumer. It contains the HTTP request headers and payload.
Response Data
Display response XML sent from SAP Gateway. It displayed the HTTP response headers and payload.
For Event Type GW_ERROR_FND the above fields in the Error Context section are optional and if activated (using configuration) then are sent to the Splunk system (in XML string).
The metric configuration is used to customize a metric event based on requirements. To access the configuration, log into the managed system and execute the /N/BNWVS/MAIN transaction code. Then go to Administrator → Setup Metric → Metric Configuration.

For event type GW_ERRPR_FND, the value of the ERROR_CONTEXT field is set to be extracted to send it to Splunk based on the below configuration. To extract the other 3 fields’ information, put ‘Parameter Value’ as X.

