KB 150 (Splunk): "No result found" in ST03 - User Profile Dashboard
|
Category: Problem |
Priority: Normal |
|---|---|
|
Platform: SAP Cloud/Splunk |
Version: 1 from 29.03.2021 |
Description
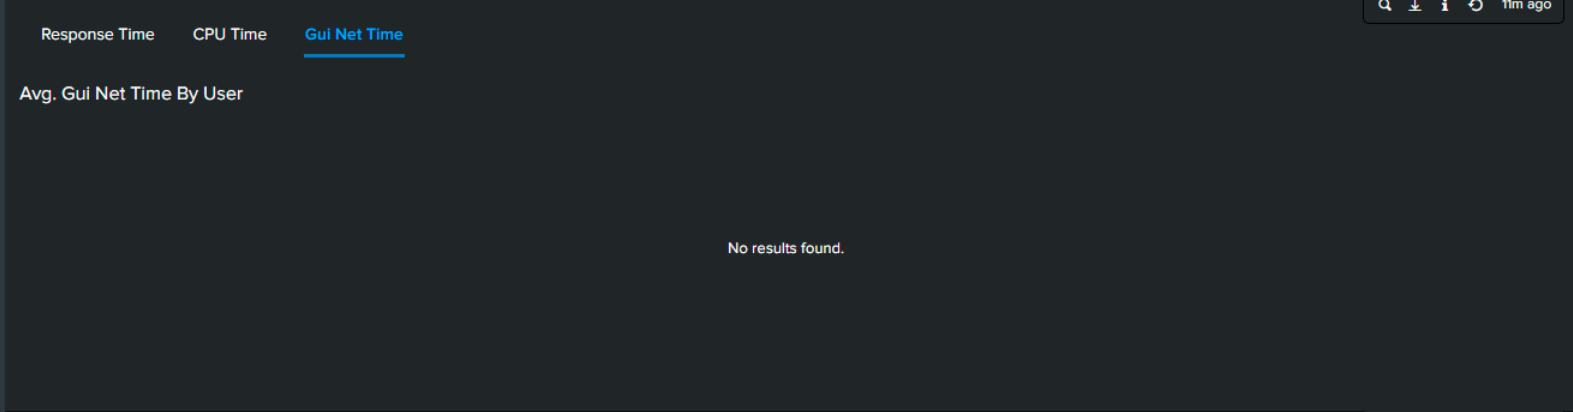
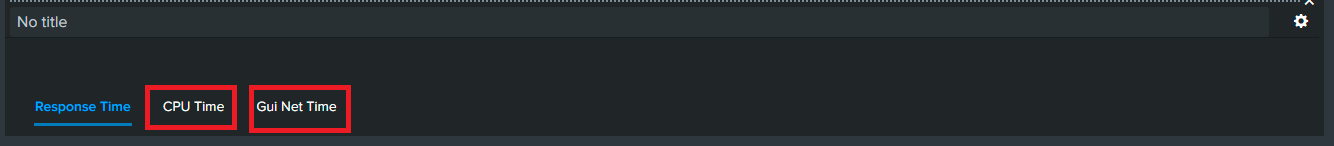
An issue was noted in Splunk 8.2.2111 ( Splunk cloud ) that the dashboard panel shows “no result found” in “ST03 - User profile dashboard” in the panel “CPU Time” or “Gui Net Time“ or “Response Time”.
When you open these in search for investigation you find that the search produces events but nothing is shown in the statistics tab.
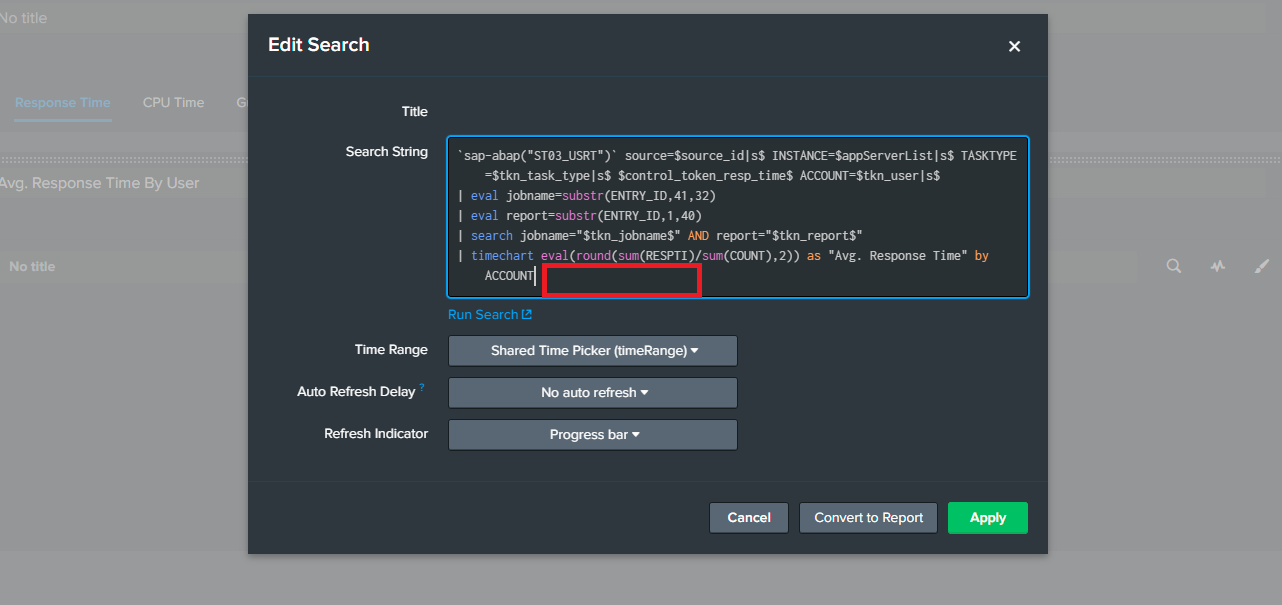
The search behind the panel is
`sap-abap("ST03_USRT")` source="GFQ" INSTANCE="*" TASKTYPE="*"  ACCOUNT="***"
| eval jobname=substr(ENTRY_ID,41,32)
| eval report=substr(ENTRY_ID,1,40)
| search jobname="***" AND report="***"
| timechart eval(round(sum(RESPTI)/sum(COUNT),2)) as "Avg. Response Time" by ACCOUNT
It is important for the search = * to be before the timechart. It acts as a filter. However, upon inspecting the job, I find the the automatic optimization forces the search to be at the end of the block ( after timechart ) and therefore there is no result found.
Here is the automatically optimized search. You can see that Splunk expands the query to the following search by typing CNTRL + SHIFT + E together on your keyboard
| search (source!=audittrail ACCOUNT="***" INSTANCE="*" TASKTYPE="*" source="GFQ"
  (sourcetype=sap:abap:ST03_USRT OR (EVENT_TYPE="ST03_USRT"
  (sourcetype=sap:abap OR sourcetype=sap_abap))))
| eval jobname=substr(ENTRY_ID,41,32)
| search jobname="***"
| eval report=substr(ENTRY_ID,1,40)
| timechart eval(round(sum(RESPTI)/sum(COUNT),2)) as "Avg. Response Time" by ACCOUNT
| search report="***"
| search report="***" get added to the end of the transformation at which point there is no data since the column report does not exists after the timechart command
Cause
This is a Splunk cloud search optimization bug noticed in Splunk version 8.2.2111
Resolution
-
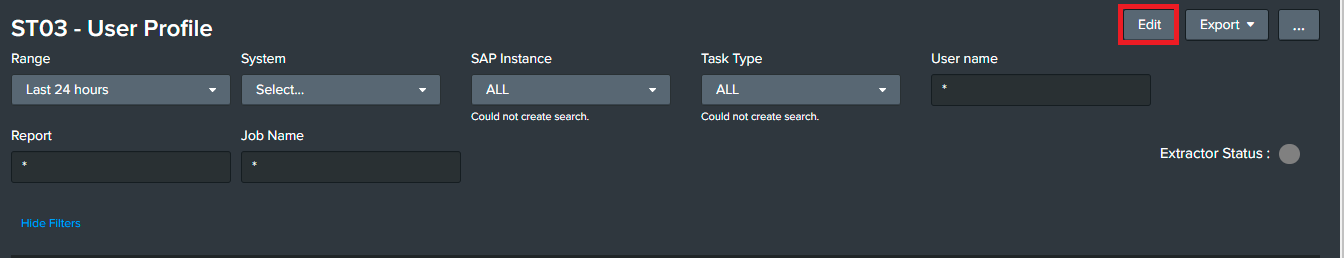
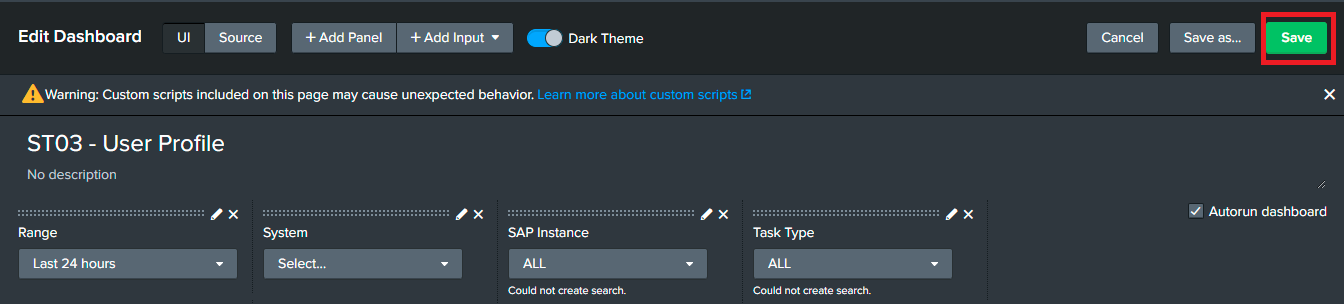
Click on the “Edit” button at the top right corner of the dashboard
-
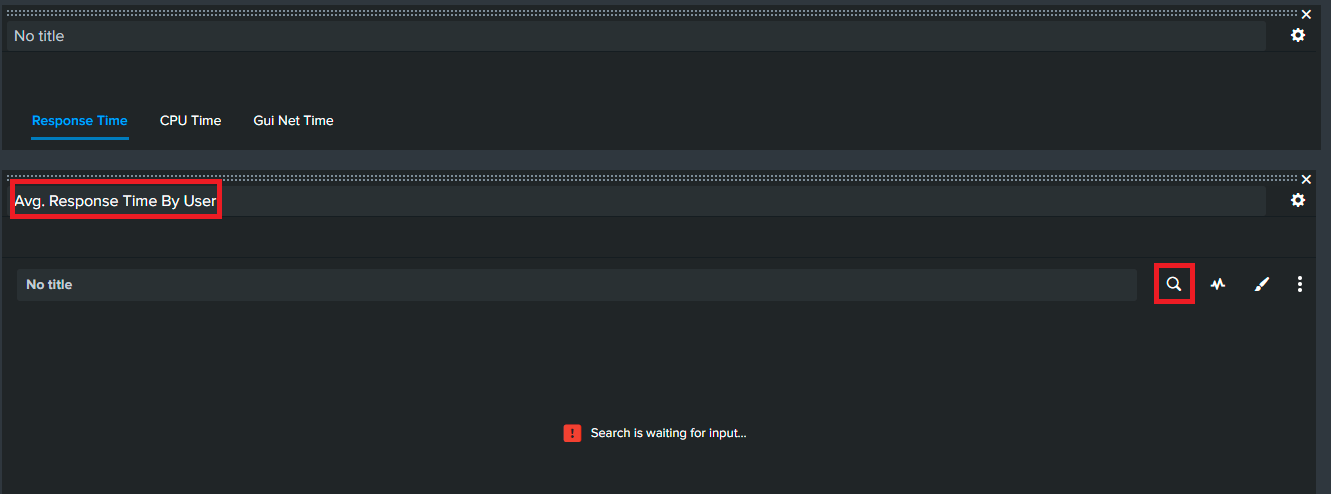
Scroll down and you can see the “Avg. Response Time By User” title then click on the magnifier icon below it.
-
Add “| noop search_optimization=false" at the end of the query.
-
Follow the same step in the “Avg. CPU Time By User” and “Avg. Gui Net Time By User” panel. If you don’t see this panel then click on the “CPU Time” and “Gui Net Time” Tab buttons respectively then you can see the panel.
-
Scroll up and click on the “Save” button at the top right corner.
Product version
|
Product |
From |
To |
|
PowerConnect Splunk App |
6.x |
Current |