KB 99 - SAP PI/PO missing messages
KB 99 (JAVA): SAP PI/PO missing messages
Category: Problem
Platform: Java(NW)
Priority: High
Version: 1 from 23.03.2021
Description
Sometimes you may be missing PI message data in Splunk. This can be caused by a number of factors outlined below.
Causes
Max Messages Setting
The PowerConnect Agent uses a SAP PI web service to retrieve PI message metadata, payloads and logs. This web service has a mandatory limit parameter which limits the number of results the web service will return. This is to protect the SAP PI system from large queries which return large numbers of results.
By default the PowerConnect agent will return 100 messages per polled interval per filter e.g. if the agent is configured to poll for PI messages every 1 minute and a single simple filter has been configured, the maximum number of PI messages each minute will be 100. The PowerConnect log shows how many PI messages are being sent per polling interval and can indicate if the max message limit is being hit e.g:

In this instance the max messages setting is 100 and PowerConnect has sent exactly 100 PI messages to Splunk and therefore has hit the limit.
The limit is also tracked as an agent health metric in version 7.x onwards.
To view this first enable health metrics reporting using the PowerConnect Java UI by navigating to Administration → Advanced then make sure the Report PowerConnect Agent Health option is checked and click Save:
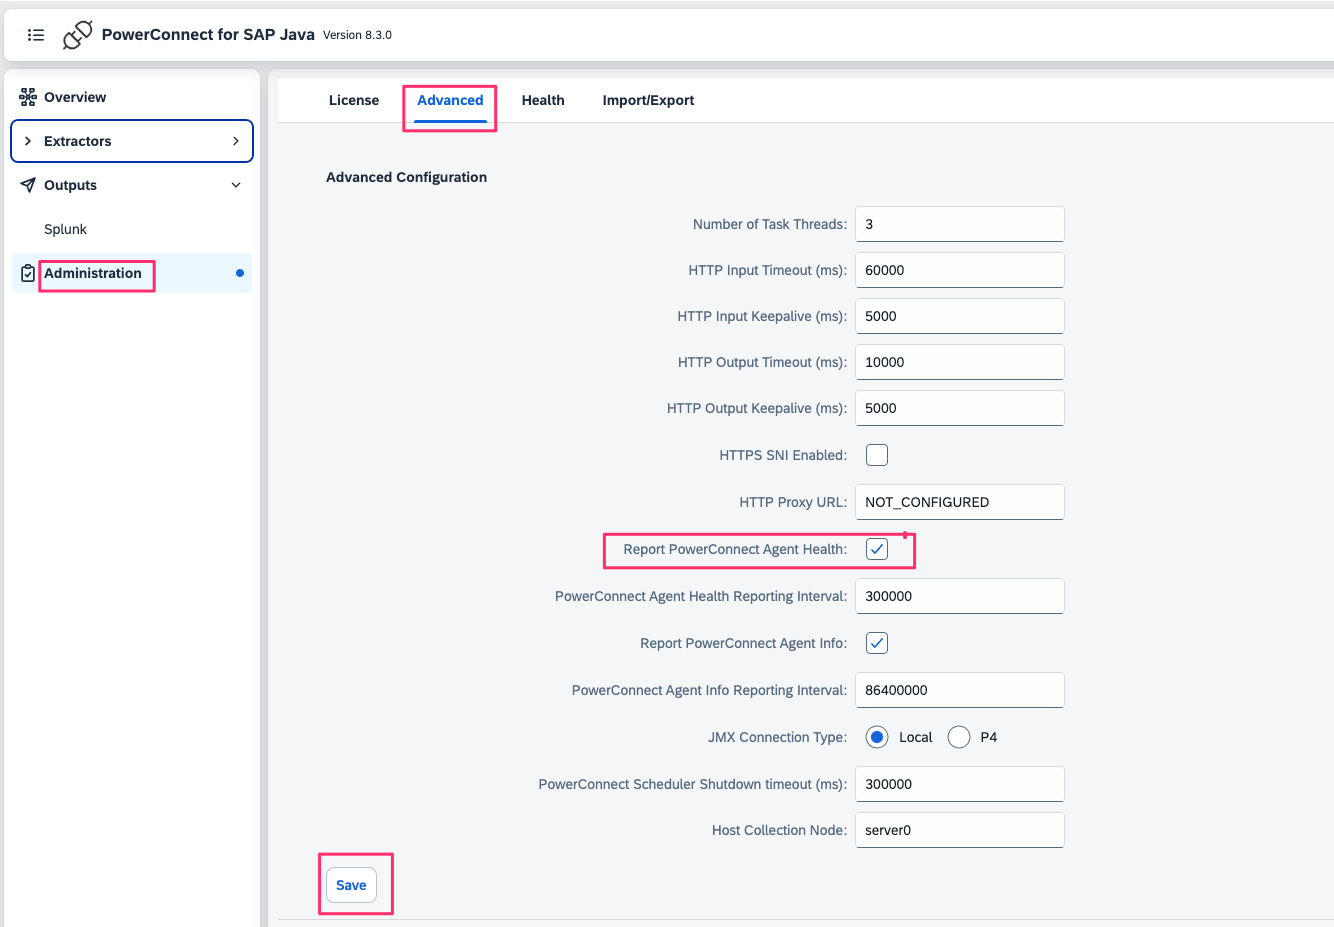
The agent health metrics will now start to be sent to your target analytics platform
The metric is tracked under the event type agent_health with mbean name value as io.powerconnect.java:name=po-ws.message-list.limit-reached
The metric is a counter and is incremented each time the limit is reached e.g.
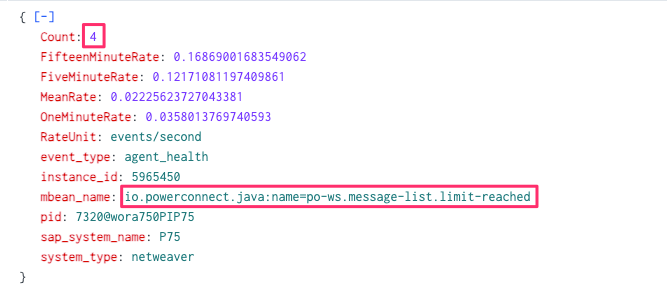
Communication Failures with Target Platform
It is possible that data is being lost due to communication failure with the target platform e.g. Splunk, Dynatrace etc. Failures can tracked using the agent health metrics.
To view this first enable health metrics reporting using the PowerConnect Java UI by navigating to Administration → Advanced then make sure the Report PowerConnect Agent Health option is checked and click Save:

The agent health metrics will now start to be sent to your target analytics platform
The metrics are tracked under the event type agent_health
Metric Name | Description |
|---|---|
| Provides average, minimum, maximum, and percentile response times for the target platform. |
| Tracks the total number of events successfully sent to the target platform. |
| Counts the total number of errors encountered while sending data to the target platform. |
| Tracks the number of retry attempts made when sending data to the target platform. |
Logged Messages
PI has two types of message persistence with regards to processing steps – staging and logging. The differences between these are documented here: https://blogs.sap.com/2012/11/06/message-staging-and-logging-options-in-advanced-adapter-engine-of-pi-73x/
Logged messages are designed to be ephemeral. They live in a cache for a period of time, then are moved to the database where certain metadata about the message is removed including the Node ID where the message was processed. Once removed from the cache these PI messages are no longer visible to the SAP PI web service as the PowerConnect agent relies on the Node ID as part of its filter so that each PowerConnect agent only retrieves messages for the node it’s running on.
This behaviour can lead to missed messages where the SAP PI cache has been purged before the PowerConnect agent has queried the web service. This is more likely to occur in high volume systems where the PI cache is purged more frequently.
To confirm whether a PI message is logged, use the PI Message Monitoring console in NWA to inspect the message. If the Quality of Service is BE (Best Effort) and the status of the message has “Log Version” as it’s value then the PI message is logged rather than staged:
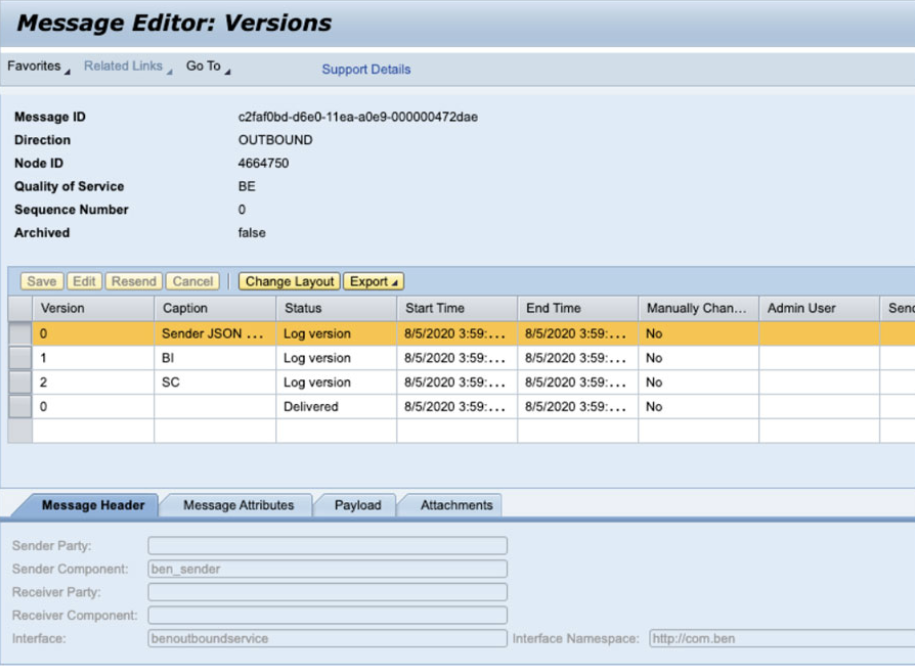
Resolution
Max Messages Setting
To raise the limit click on the PI Monitoring tab in the PowerConnect UI, click Messages → Configuration then increase the “Max number of messages per interval” setting:
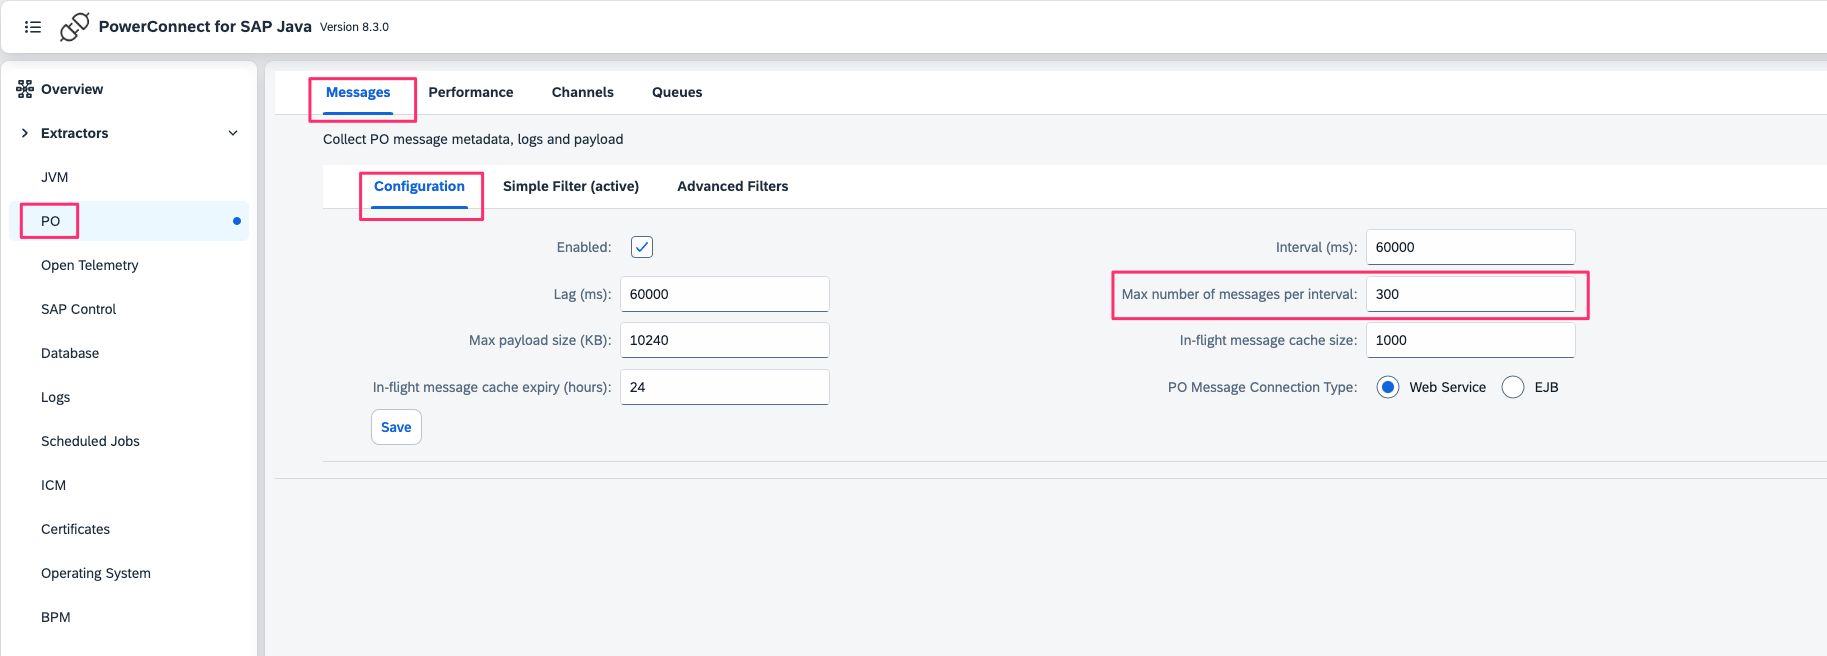
Note: SAP has implemented this limit to safeguard the system from large queries that could impact performance or cause instability. It is recommended to first test any increase to this setting in a performance testing environment under production-like load conditions. Additional filtering options, such as restricting data collection to specific interfaces, can also be applied. For further clarification, please contact support.
Retry Setting
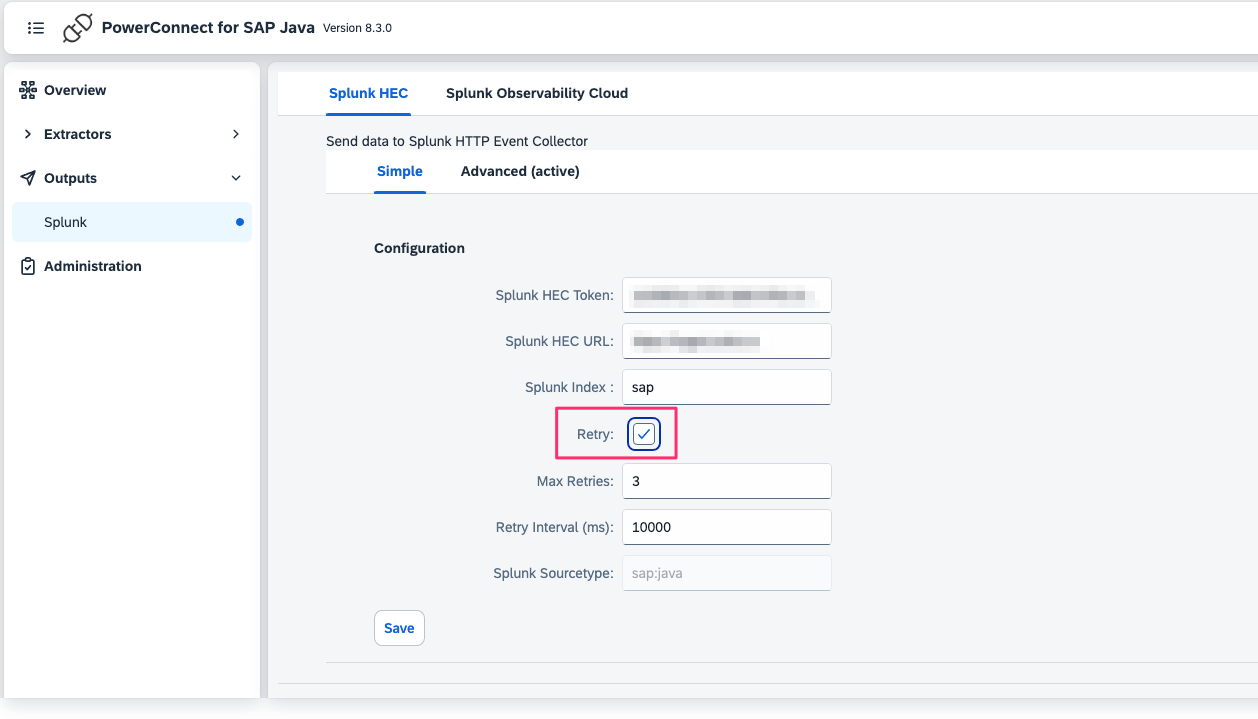
If health metrics indicate communication errors between the SAP Java system and the target analytics platform, the agent can be configured to retry.
To enable retries:
In the PowerConnect Java UI, navigate to Outputs → <Target Platform Name> → <Target Output Type>.
Under Configuration, enable the Retry option.
By default, the agent will attempt up to 3 retries, with a 10-second interval between each attempt.
Logged Messages
In this scenario if messages are being missed, it is recommended to convert them to staged messages so that they are persisted with the relevant metadata and are not subject to cache expiry.
Product version
Product | From | To |
PowerConnect NW | [Affected version from] | [Affected version to] |
[SAP product version]
Product | Component | From | To |
