SM37
Data Description
The SM37 event is used in SAP to monitor batch jobs executed in the background.
Potential Use Cases
This event could be used for the following scenarios:
Visualize and trend historical batch job runtime
Monitor cancelled batch jobs
Alert on long-running batch jobs
Parse errors from job logs
Parse data from batch job spool files
Correlate batch jobs to work process logs
Correlate batch jobs to ABAP dumps
Identify delayed batch job execution
Metric Filters
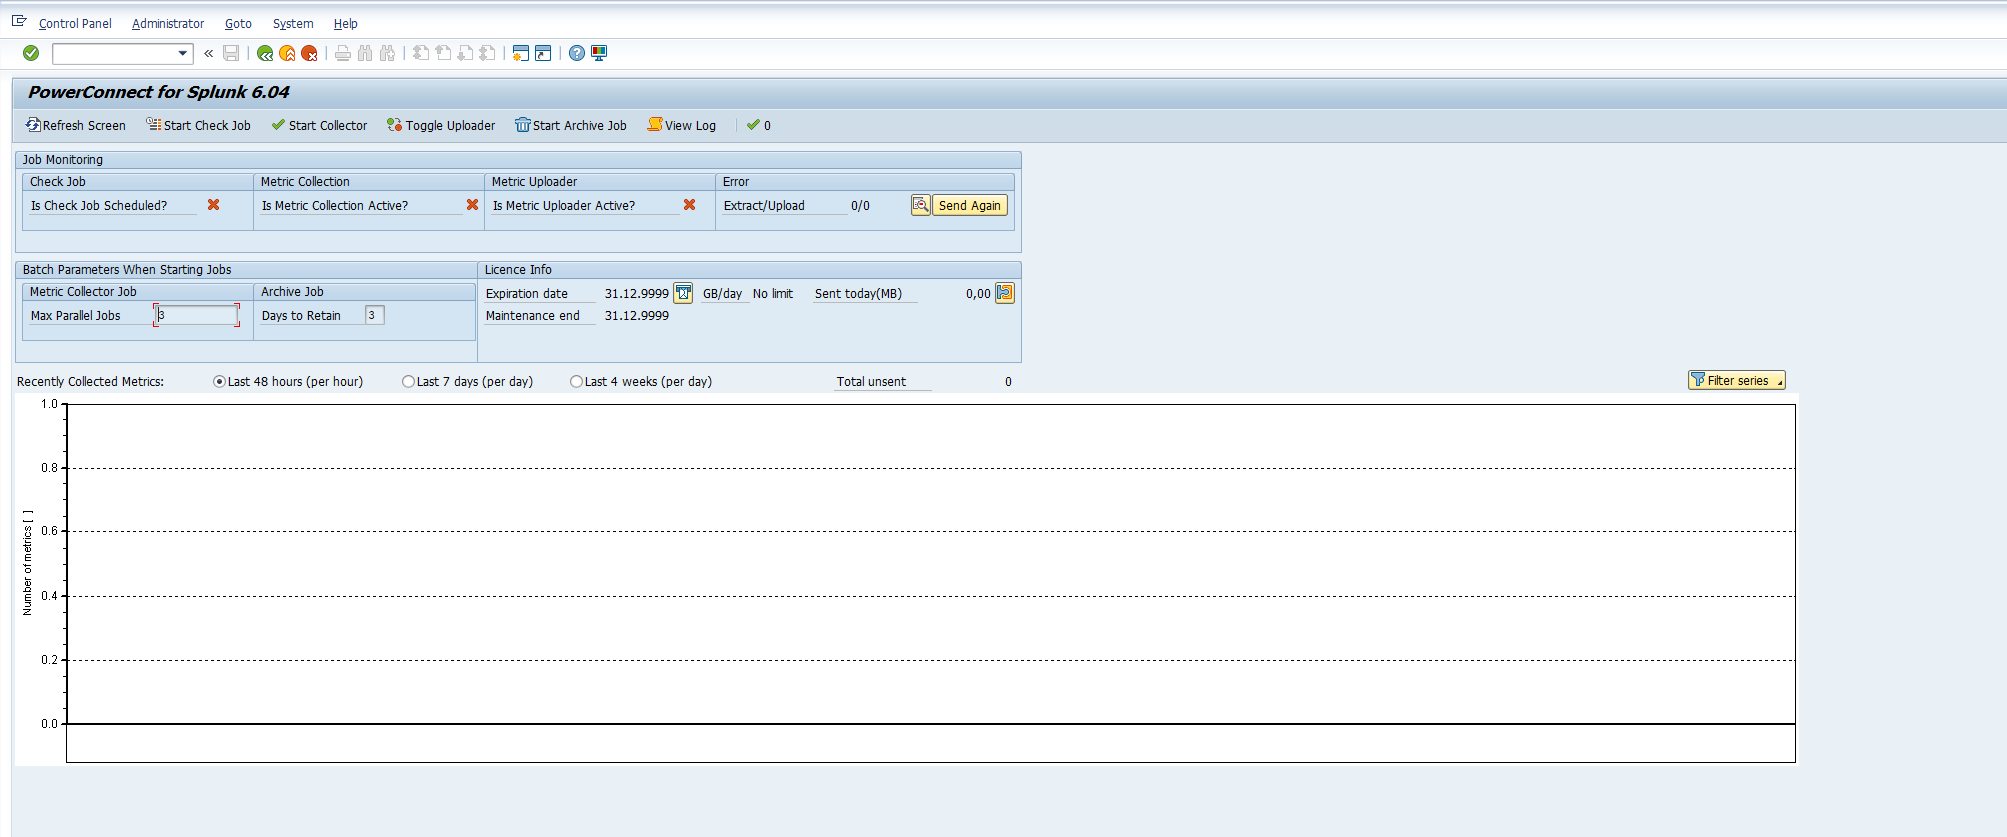
To activate the collection of the spool files and job logs for a particular batch job please complete the following steps log into the managed system, and execute the /n/bnwvs/main transaction.
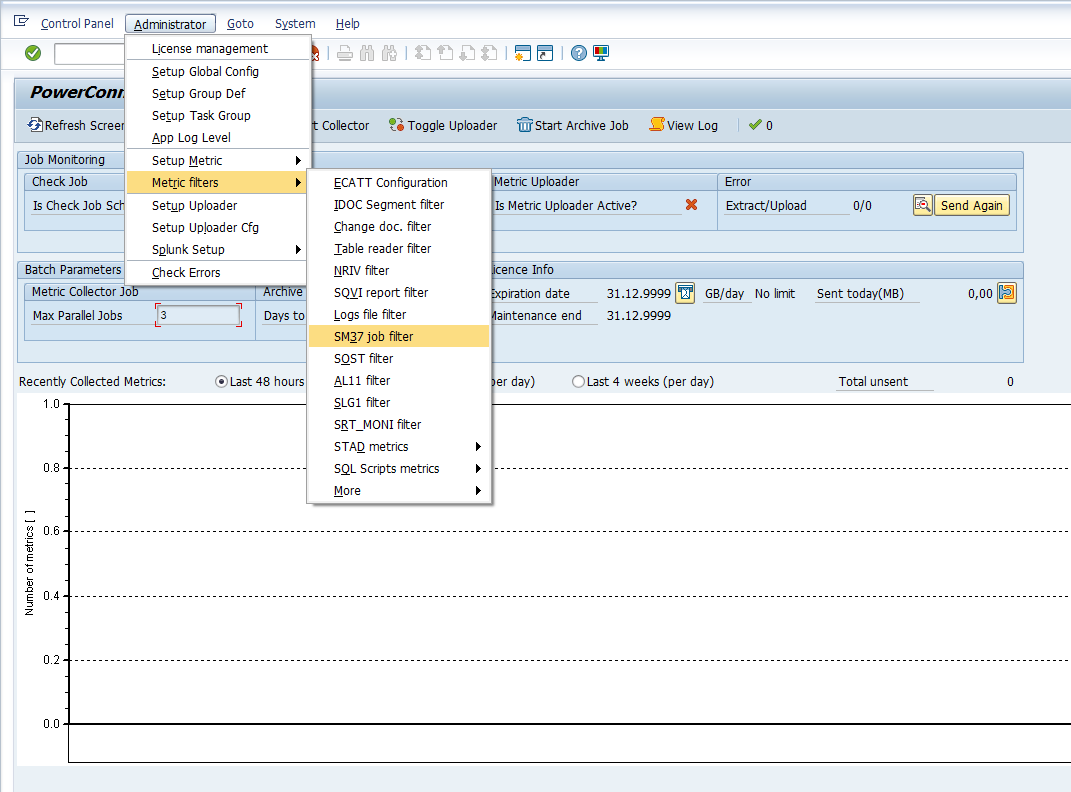
Then go to Administrator → Metric filters → SM37 job filter
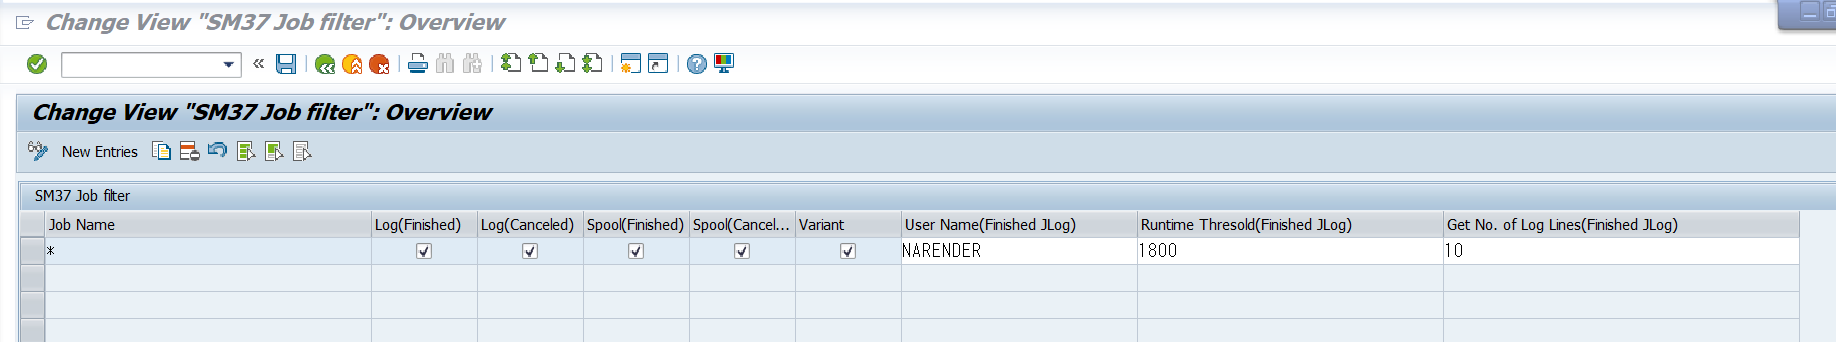
Once in the SM37 job filter, select the “New Entries” button. Then place the string value for the batch job name that you would like to collect the data for. Please note that wildcards are accepted. Then select the checkboxes that meet your desired criteria:
Finished(Log) - Extracts the job log from batch jobs with a Finished status
Cancelled(Log) - Extracts the job log from batch jobs with a Cancelled status
Finished(Spool) - Extracts the spool file from batch jobs with a Finished status
Cancelled(Spool) - Extracts the spool file from batch jobs with a Cancelled status
Variant - Extract the Jobs input Variant details
User Name(Finished Job Logs): Extracts the Logs of Finished Jobs if the User Name with which the Job was executed matches this input
Runtime Thresold(Finished Job Logs): This value is in seconds. Extracts the Logs of Finished Jobs only when the Runtime of the Job is greater than or equals to this value.
Get No. of Log Lines(Finished Job Logs): Number of Job Logs line to be Extracted for the Finished Jobs.
After completing the configuration, hit the “Save” button and exit out of the PowerConnect administration console. The data should start being collected based on the filter criteria.
Splunk Event
Please note that the JOBNAME and JOBCOUNT fields can be used to distinguish unique job executions in the SAP environment.
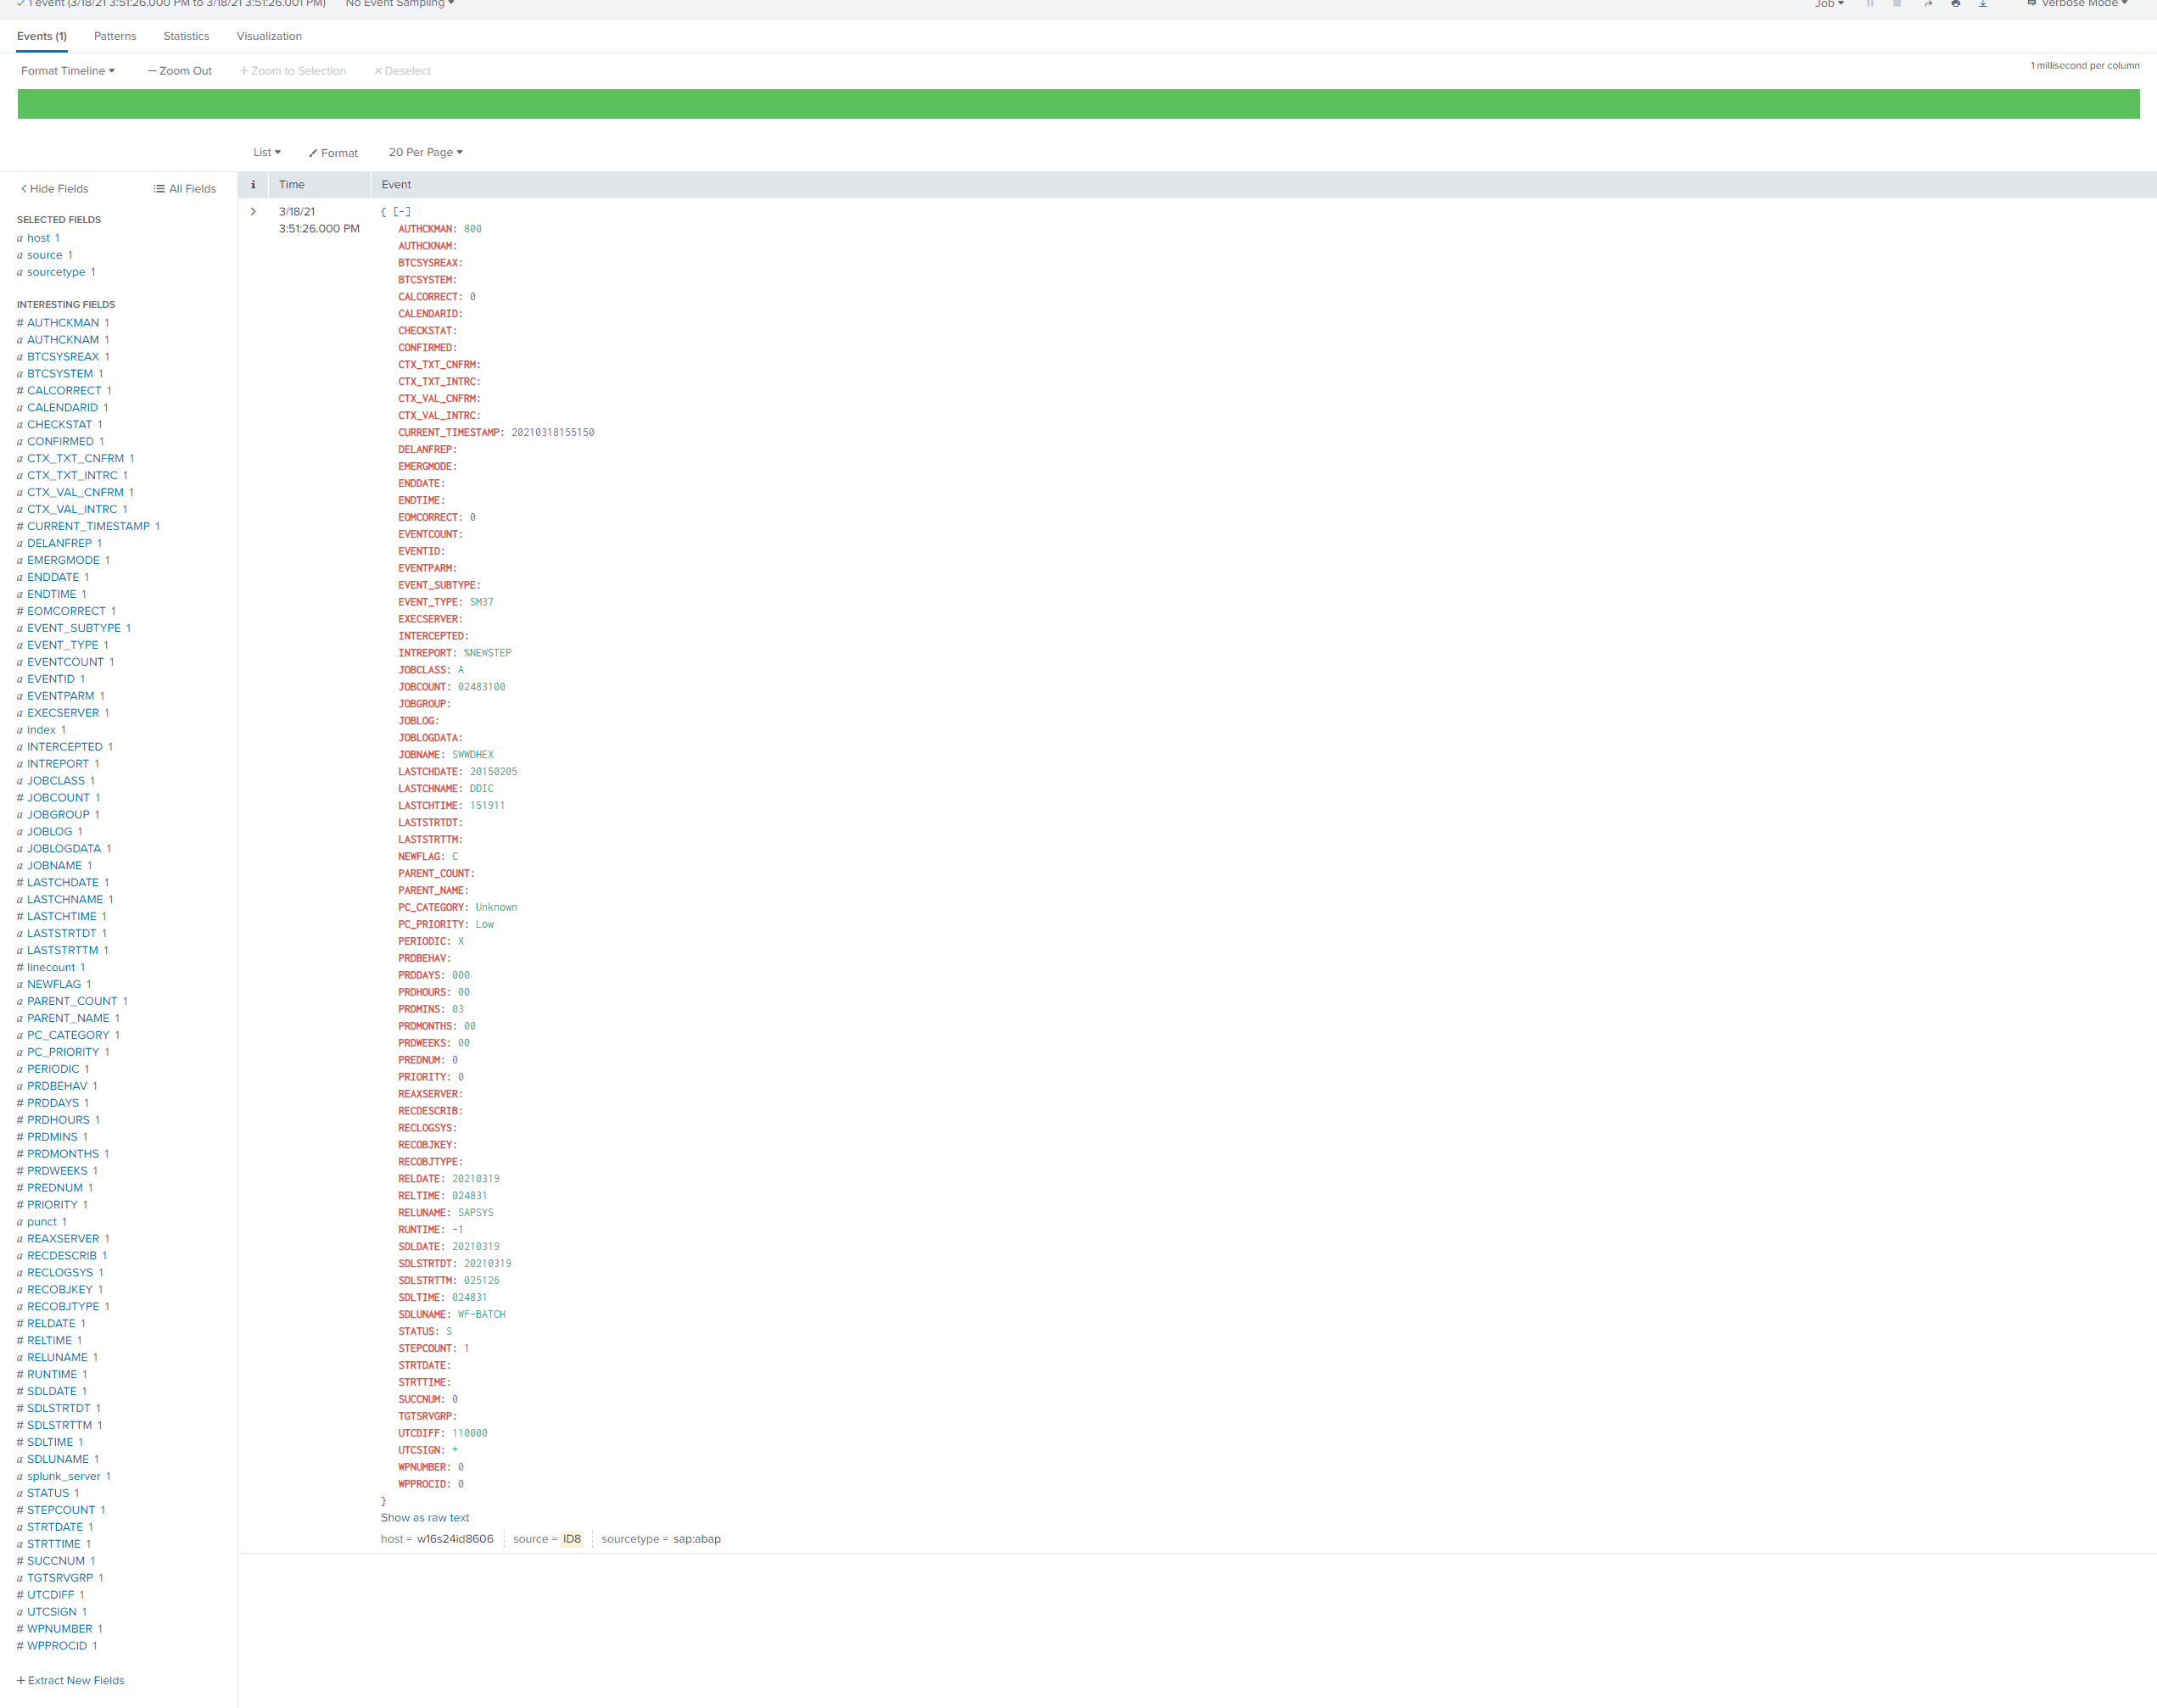
SM37 with EVENT_SUBTYPE=””
The event will look like this in Splunk:
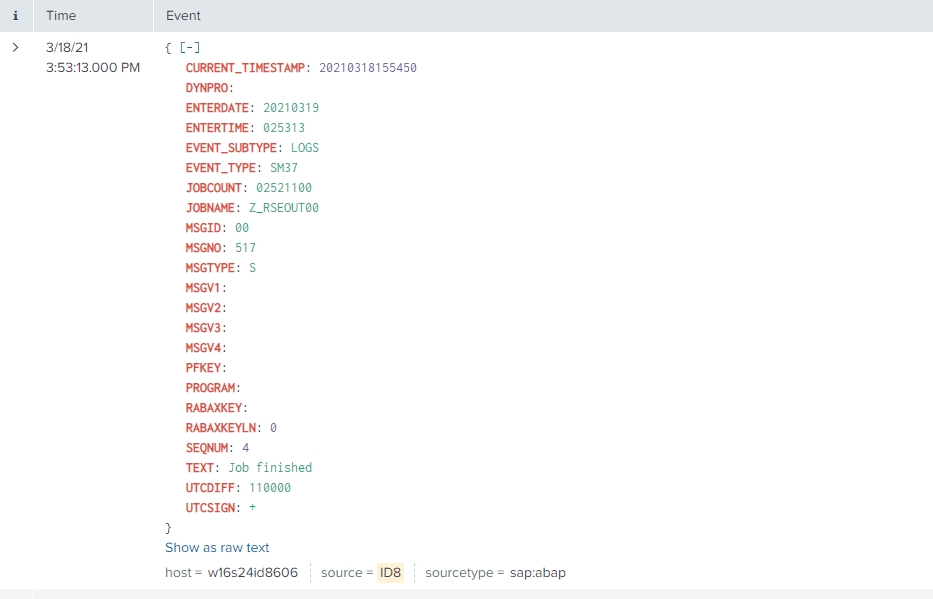
SM37 with EVENT_SUBTYPE=”LOGS”
The event will look like this in Splunk:
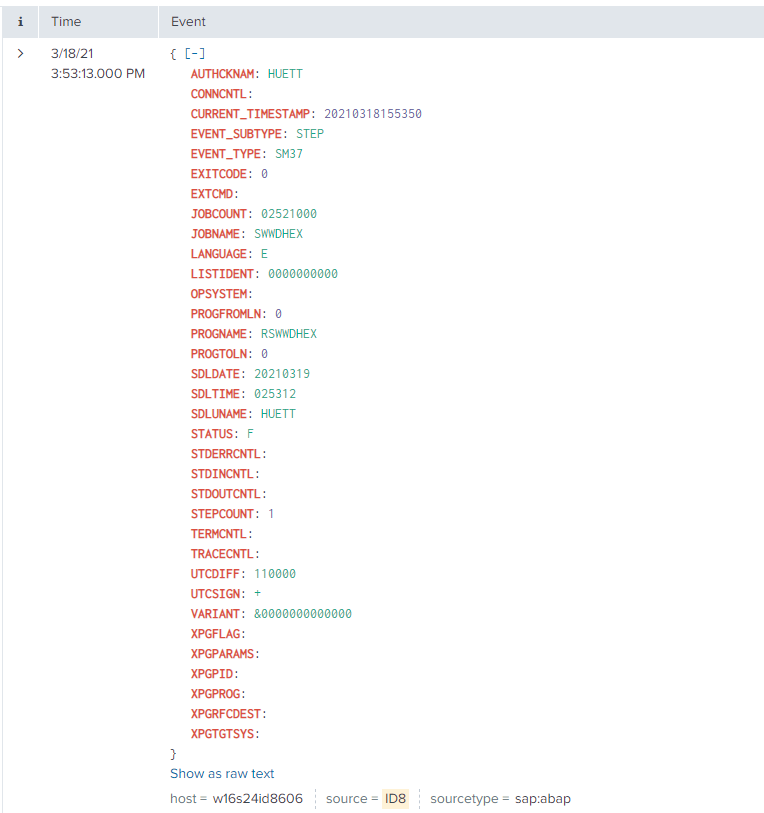
SM37 with EVENT_SUBTYPE=”STEP”
The event will look like this in Splunk:
SM37 with EVENT_SUBTYPE=”SPOOL”
The event will look like this in Splunk:

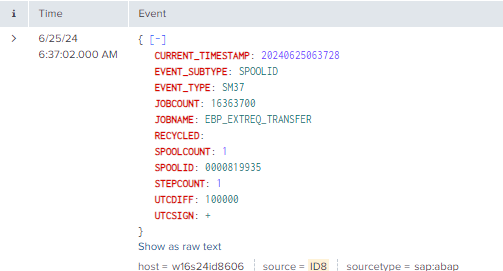
SM37 with EVENT_SUBTYPE=”SPOOLID”
The event will look like this in Splunk:
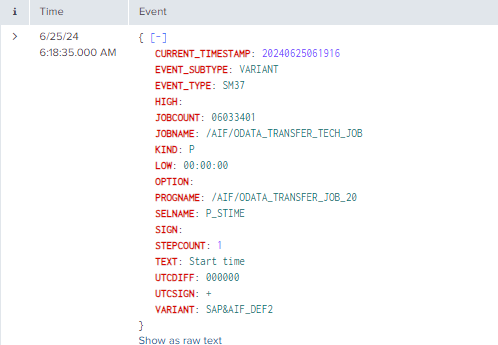
SM37 with EVENT_SUBTYPE=”VARIANT”
The event will look like this in Splunk:
SAP Navigation
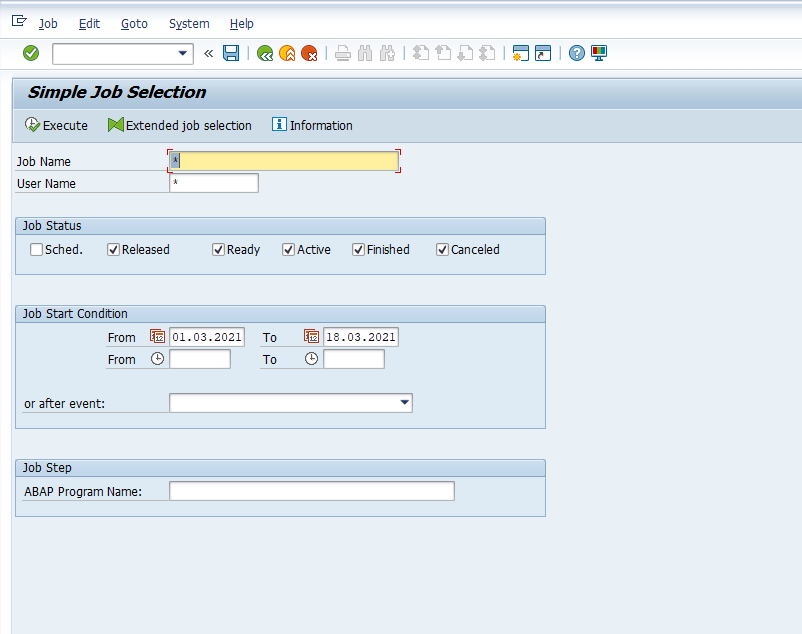
Navigate to this data by using the SM37 t-code in the managed system.
Once you have entered the SM37 t-code, enter the selection criteria and select “Execute”.
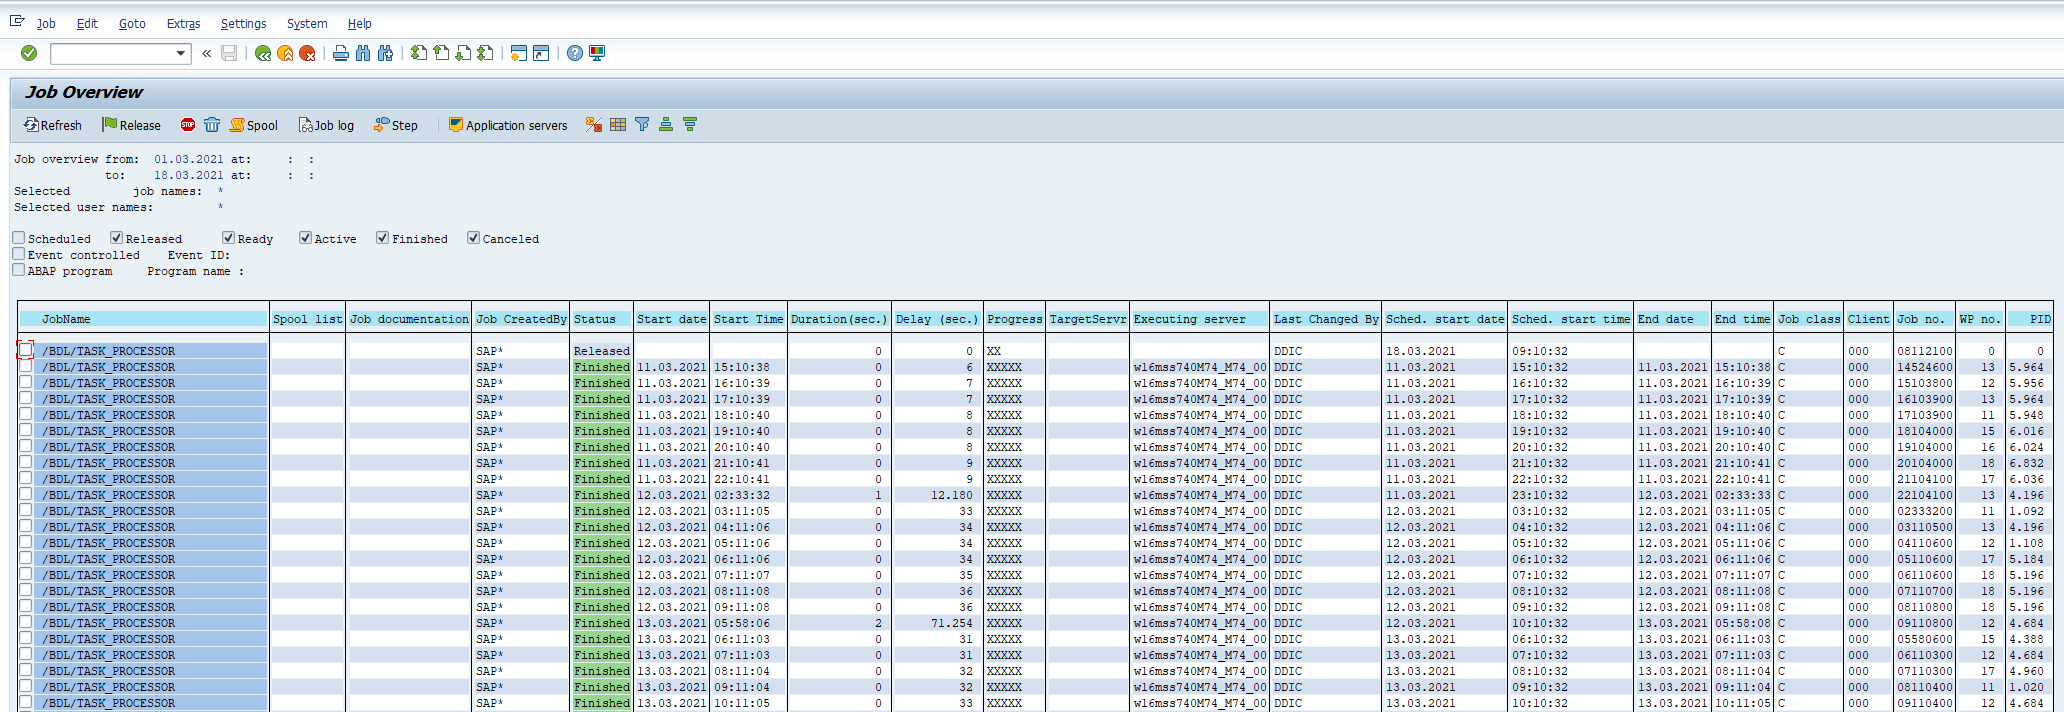
The SM37 data will now appear:
The data from the SM37 transaction is divided into several EVENT_SUBTYPEs in Splunk. Below are screenshots indicating where the data originates from for each EVENT_SUBTYPE.
SM37 with EVENT_SUBTYPE=””
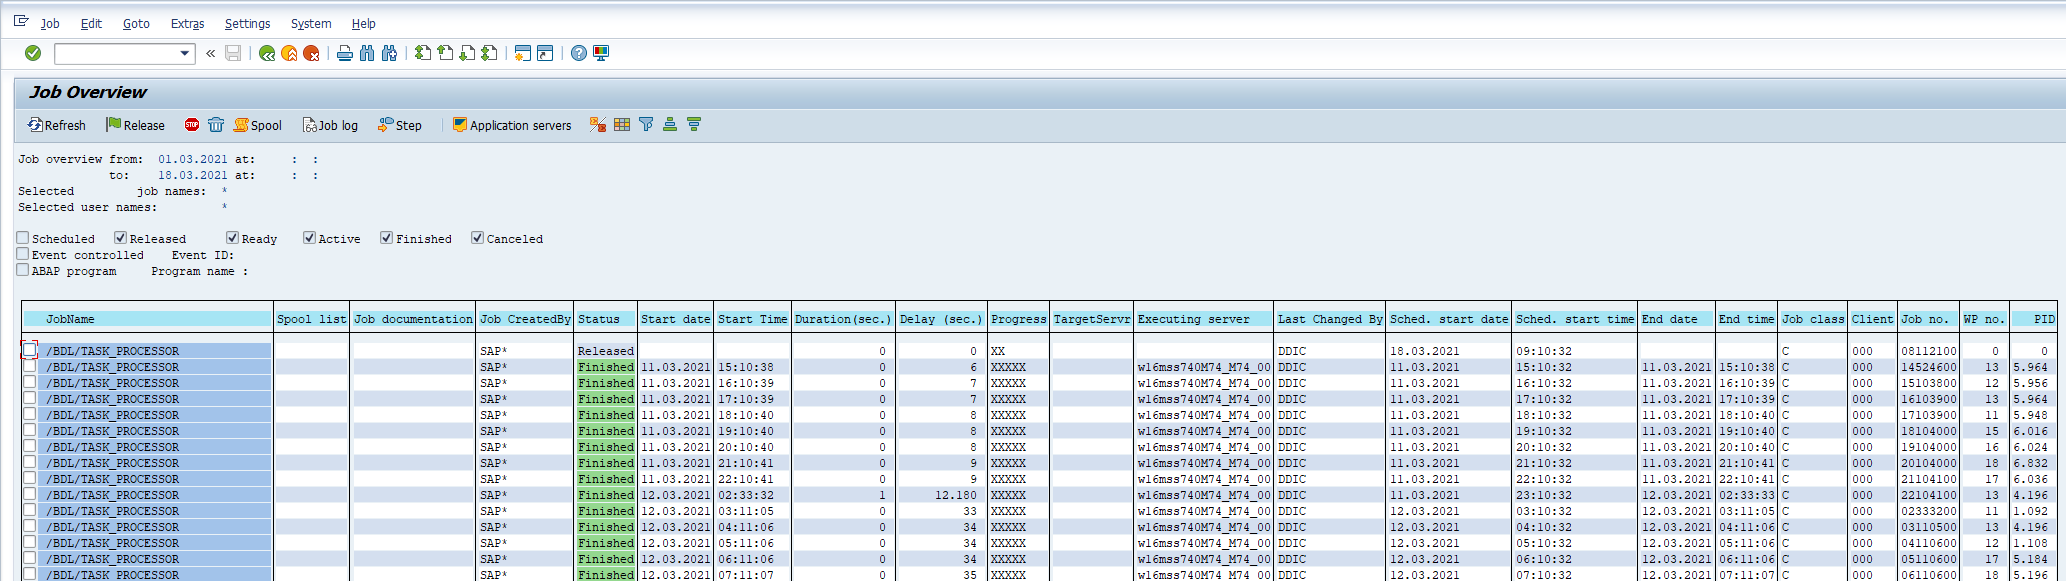
The data from this EVENT_SUBTYPE originates from the TBTCO table, and can be viewed in the following SM37 screens:
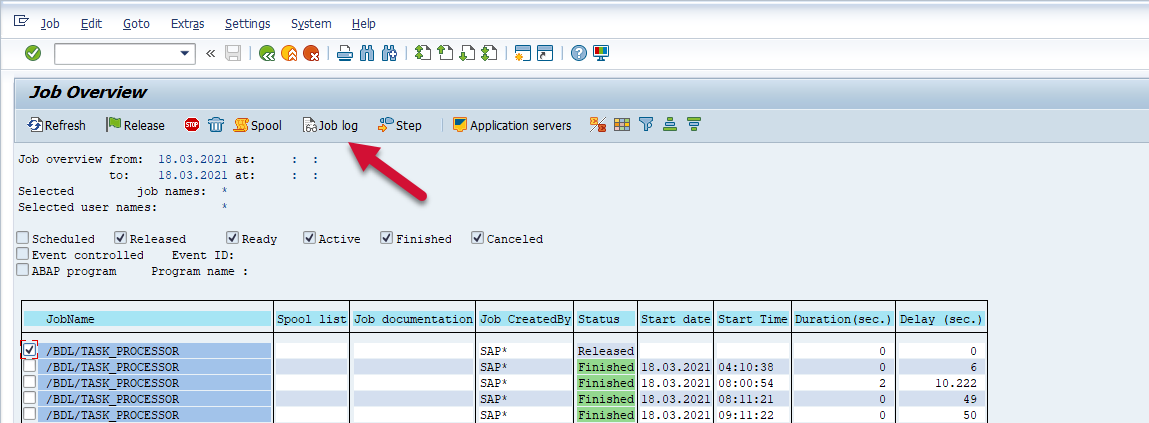
Job Overview
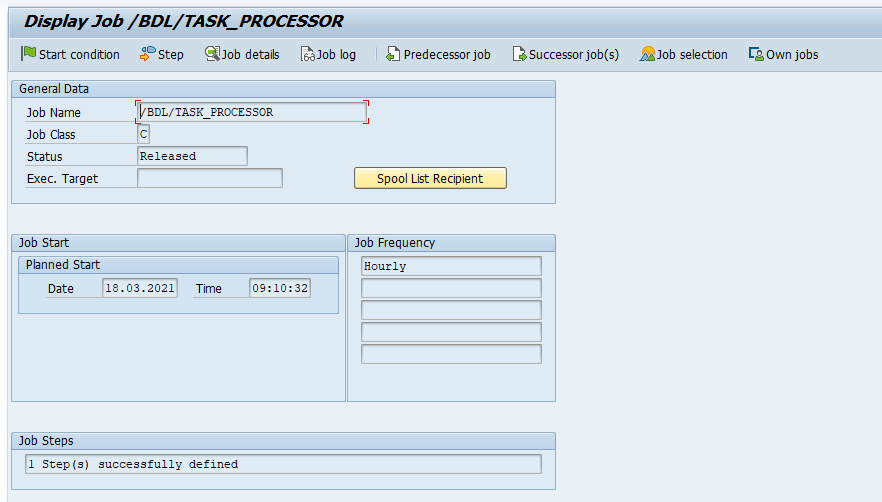
Display Job
Accessed by double clicking a job name from the “Job Overview” screen:
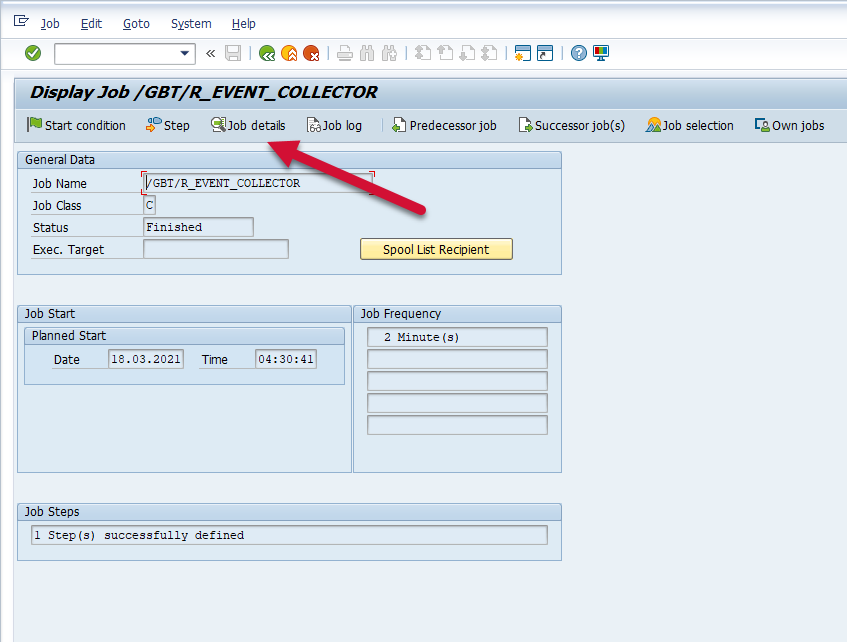
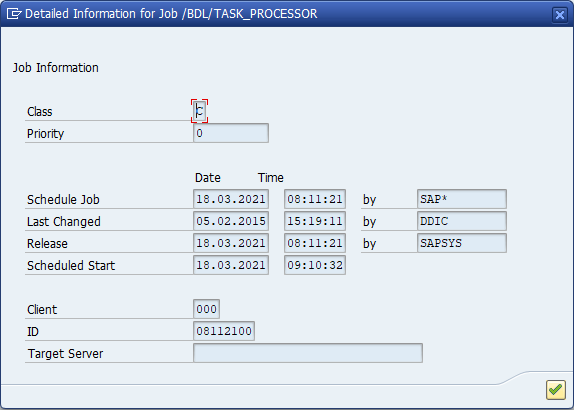
Job Details
Accessed by clicking the “Job details” button from the “Display Job” screen:
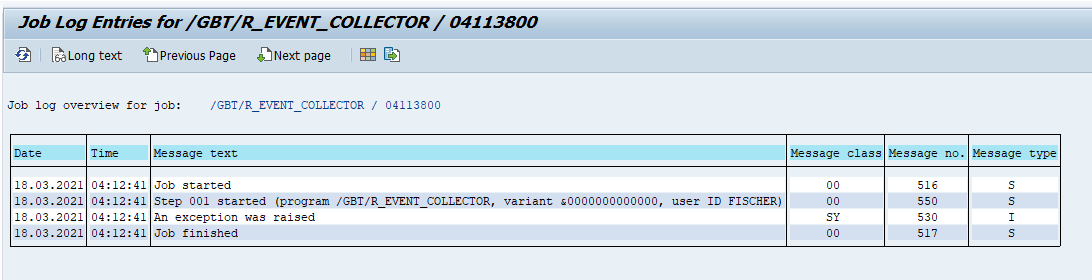
SM37 with EVENT_SUBTYPE=”LOGS”
The data from this EVENT_SUBTYPE originates from the TBTC5 table and the job logs associated with the batch job, and can be viewed in the following SM37 screens:
Job Overview
Job Log
Accessed by clicking the “Job log” button from the “Job Overview” screen.
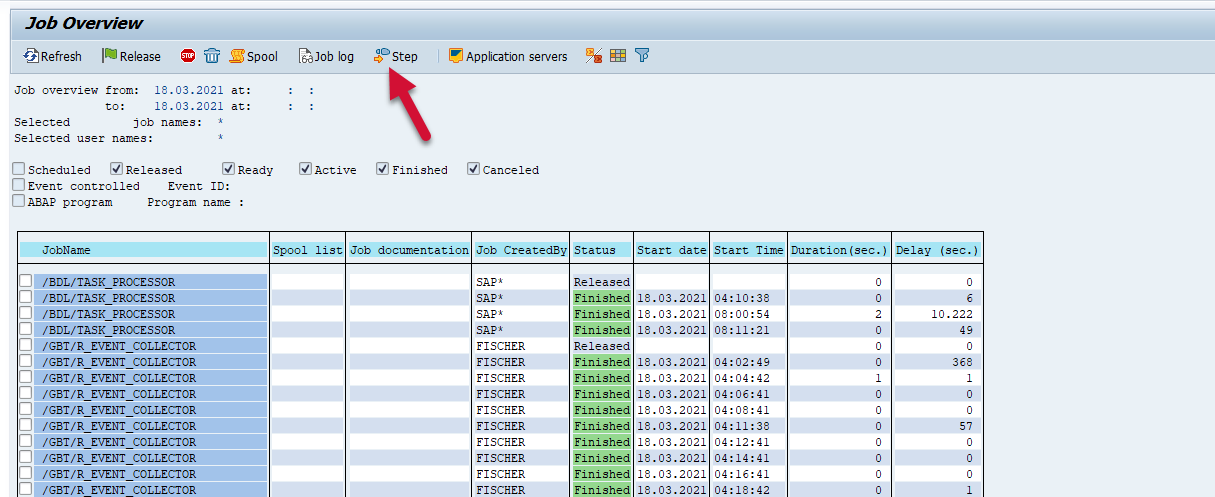
SM37 with EVENT_SUBTYPE=”STEP”
The data from this EVENT_SUBTYPE originates from the TBTCP table, and can be viewed in the following SM37 screens:
Step List Overview
Access by using the “Step” button from the “Job Overview” screen

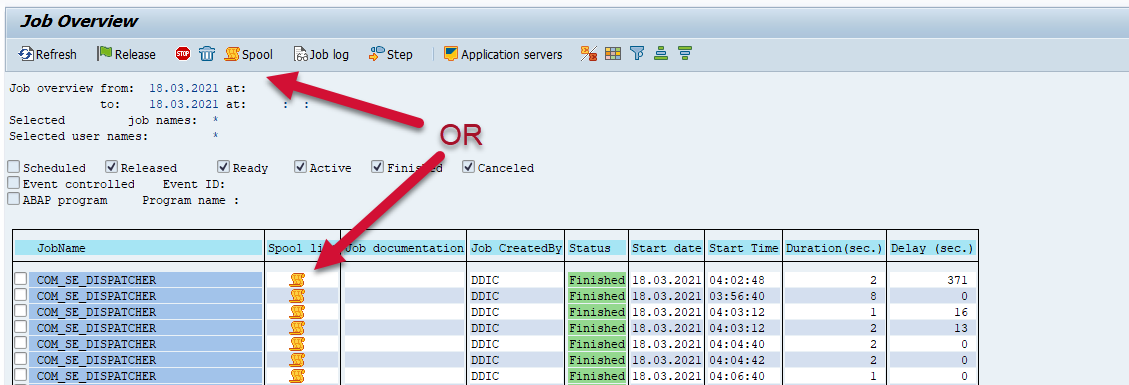
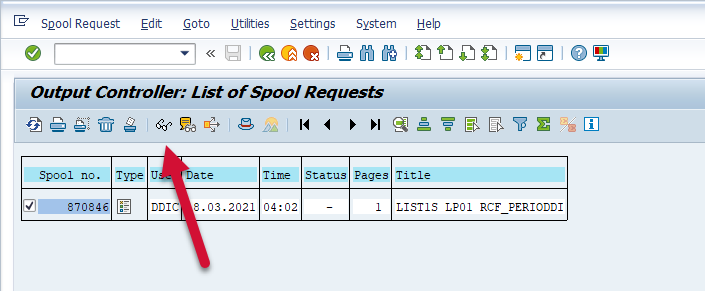
SM37 with EVENT_SUBTYPE=”SPOOL”
The data from this EVENT_SUBTYPE originates from the spool files associated with the batch job, and can be viewed in the following SM37 screens:
Output Controller: List of Spool Requests
Access by using the “Spool” button from the “Job Overview” screen or clicking the spool icon from the “Job Overview” screen
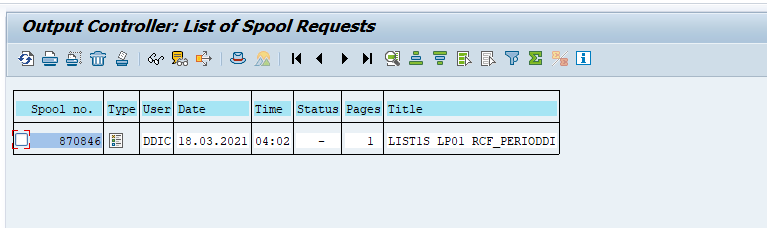
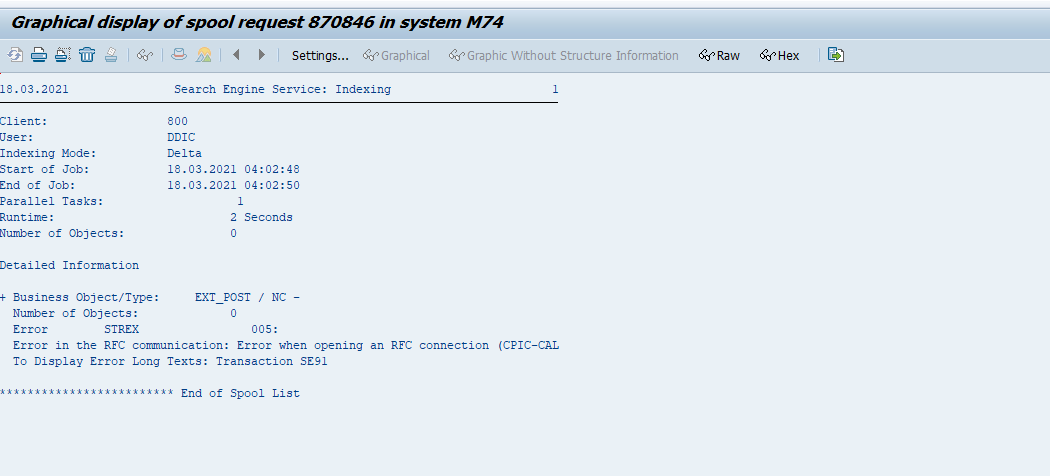
Graphical display of spool request in system
Access by using the “Spool” button from the “Job Overview” screen or clicking the spool icon from the “Job Overview” screen
Once in the “Output Controller List of Spool Requests” page click on the “Display contents” button
Then the spool file will be visible in the “Graphical display of spool request in system” screen