
SMQ2
Data Description
The SMQ2 event is used in SAP to view and administer inbound qRFC entries.
Potential Use Cases
This event could be used for the following scenarios:
Alert on qRFC errors for a specific destination.
Create a dashboard of qRFC error trends over time
Metric Configuration
The 8.0 version of PowerConnect introduces a feature that extends its capabilities to gather statistical information for inbound qRFC. This enhancement provides users with the flexibility via Metric Configuration to selectively retrieve only statistical data, allowing them to bypass the retrieval of the entire qRFC entries. This is particularly advantageous in larger SAP landscapes generating a substantial volume of entries. In such scenarios, users can now focus solely on obtaining essential statistical insights, eliminating the need to transmit extensive data to the Splunk system. This optimization caters to the specific needs of customers who prioritize obtaining key statistical information efficiently within the context of their SAP environment.
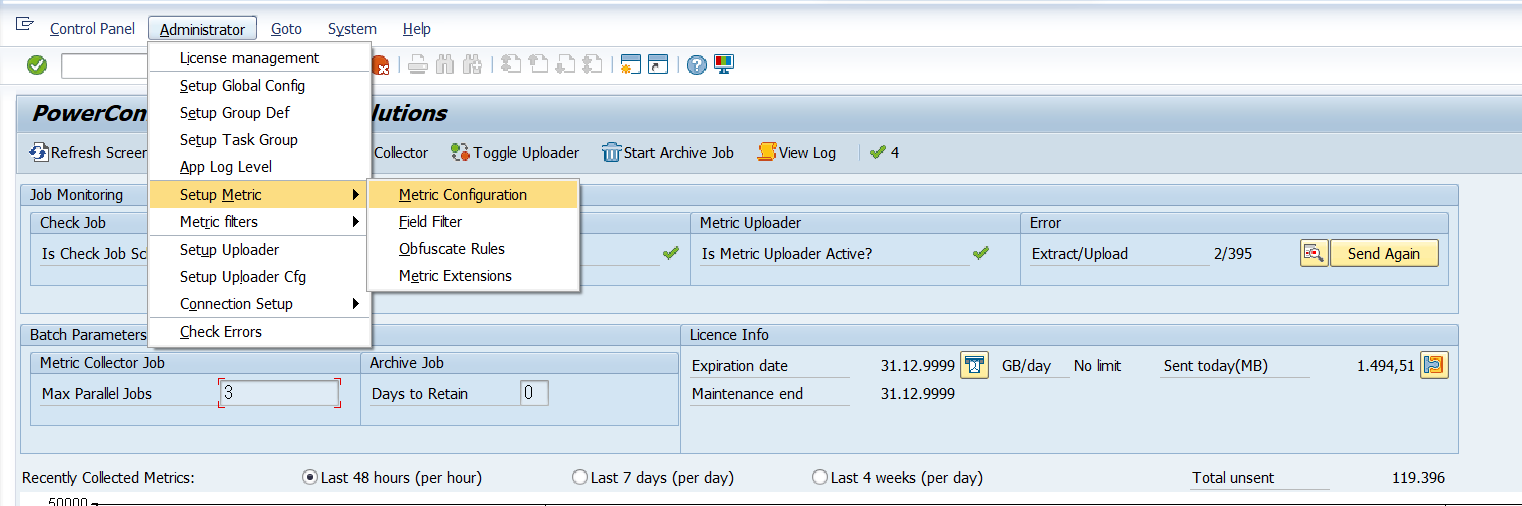
Maintain the SMQ2 metric configuration using the menu option below (Administrator->Setup Metric->Metric Configuration)
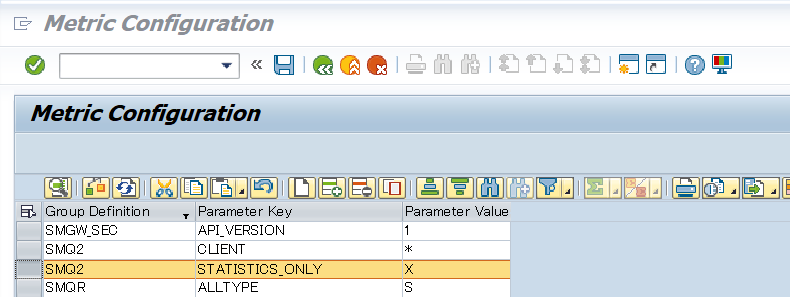
By default, the extraction process includes both statistical information and detailed qRFC data. However, if the objective is to exclusively obtain statistical insights and deactivate the retrieval of detailed information, simply set the value of the parameter STATISTICS_ONLY to 'X'. This configuration adjustment ensures that only essential statistical data is retrieved, streamlining the extraction process according to the specified preference.
Splunk Event
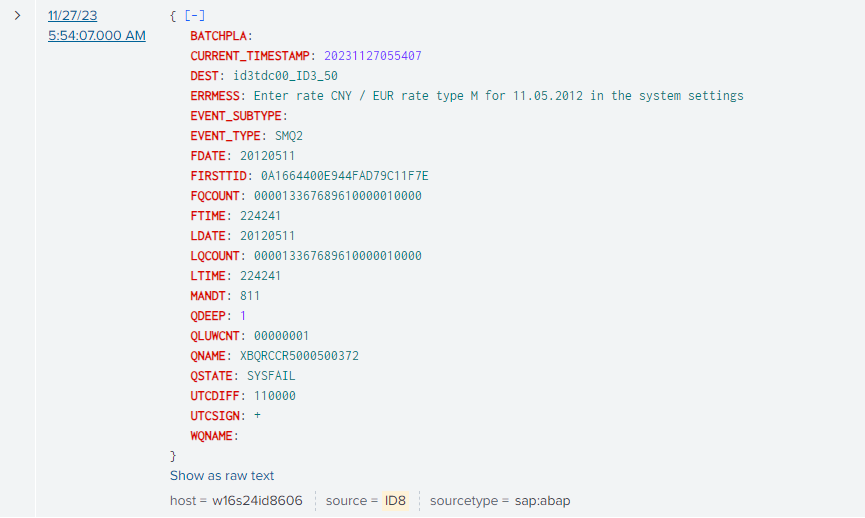
The event will look like this in Splunk:
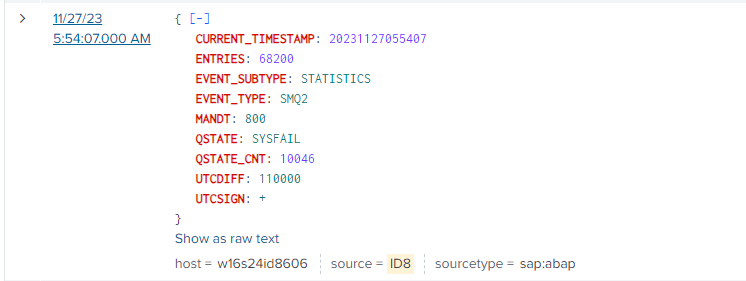
The statistical information (as per queue state & SAP client) is available in Event Subtype ‘STATISTICS’ as shown in the below screen.
SAP Navigation
Navigate to this data by using the SMQ2 t-code.
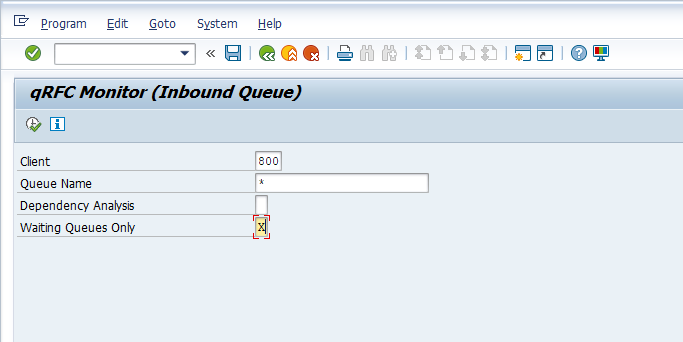
Enter “X” in the Waiting Queues Only field, and hit the Execute button.
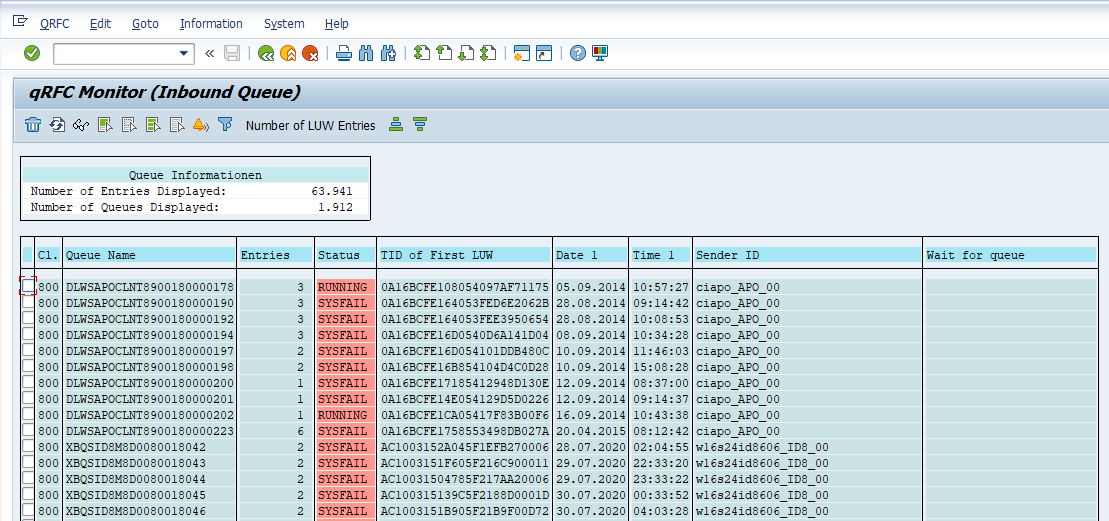
You will now be able to see which qRFC entries have failed. Double-click on the value you are interested in the Queue Name field
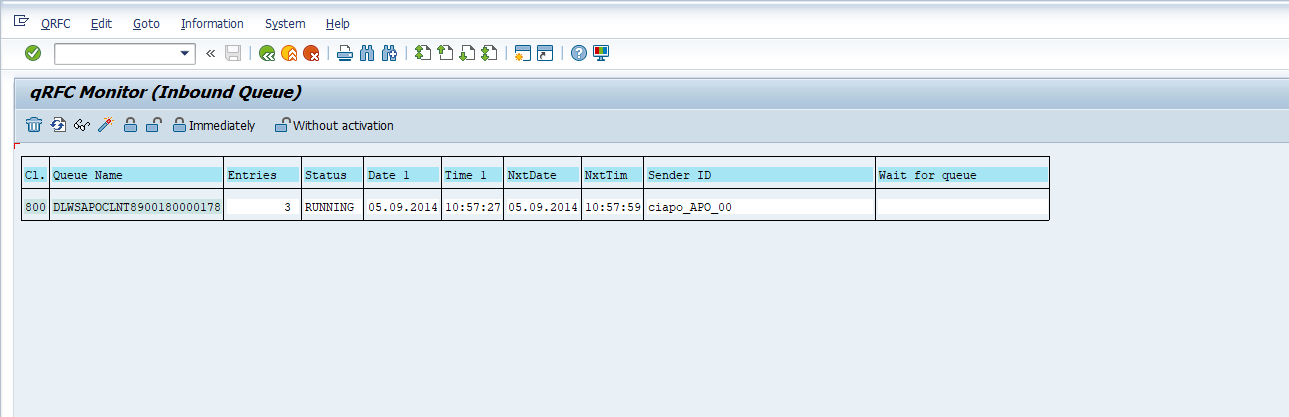
You will now be able to see when the qRFC failure was created, the sender, and the number of entries. Double-click on the qRFC name to proceed to the next screen.
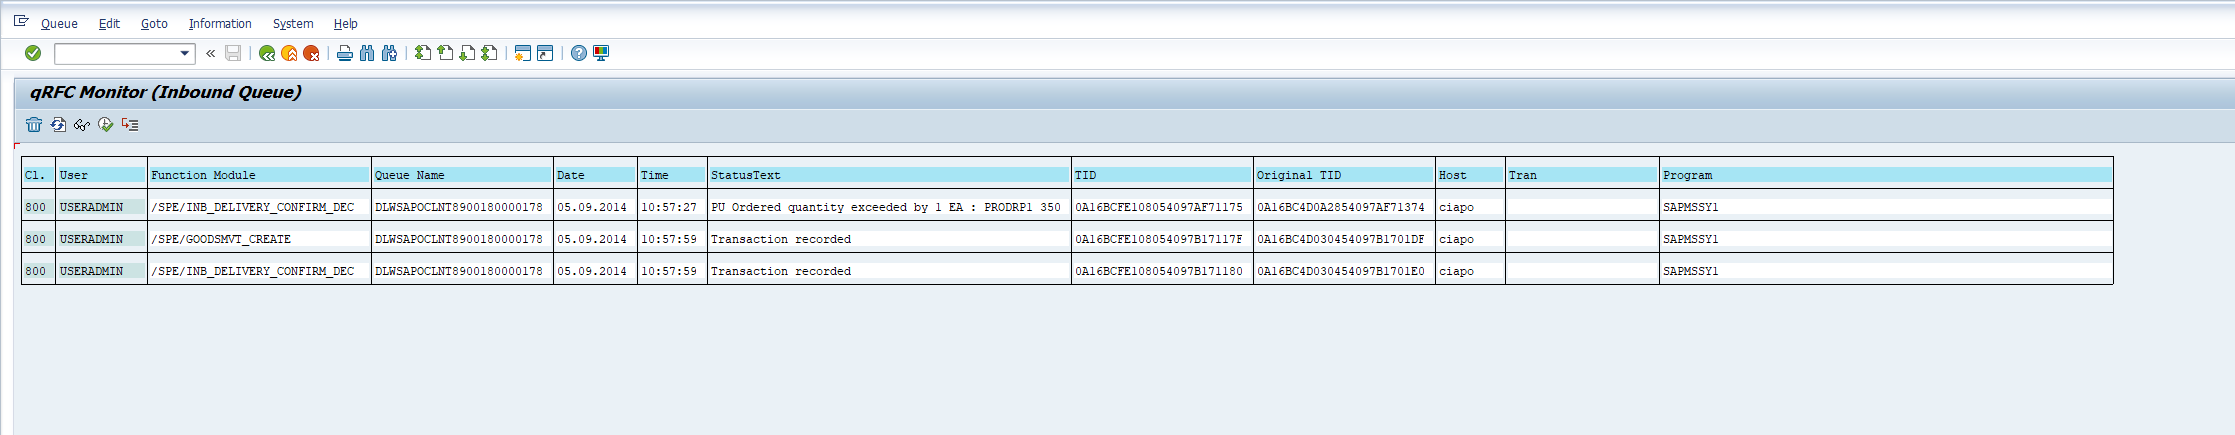
You will now be able to see the qRFC error detail.