
STAD - SAP Performance Monitor/statistics records
Data Description
The STAD event is used to evaluate system performance based on statistic records generated by SAP and includes performance metrics like CPU, memory consumption, DB, RFC, HTTP call metrics etc.
Potential Use Cases
This event could be used in the following scenarios:
Identify performance bottlenecks in application call perform.
Identify long-running application calls or slow application performance.
Identify long-running DB calls
Identity slow RFC, HTTP calls as well as slow server side processing.
Correlate transactions between SAP Java and ABAP solutions using PowerConnect.
Metric Filters
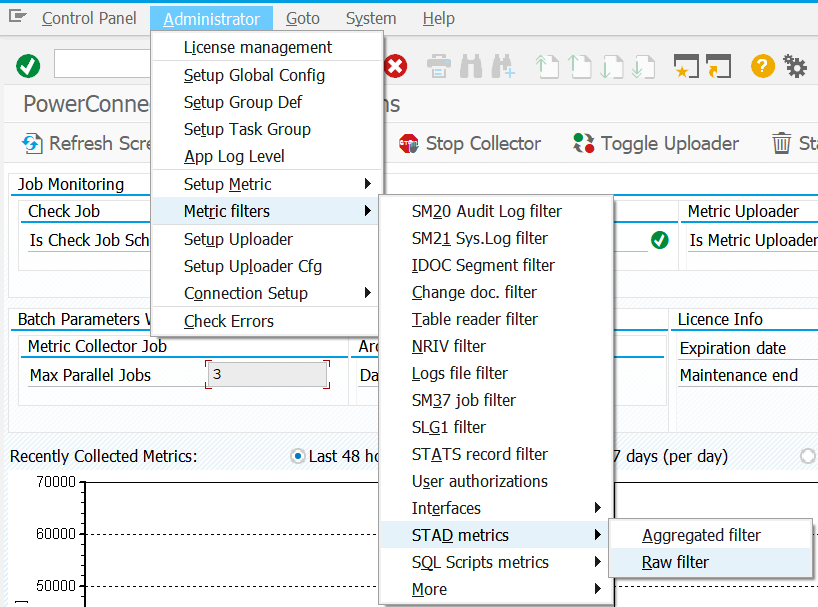
Log into the managed system, and execute /N/BNWVS/MAIN transaction. Then go to Administrator → Metric filters → STAD metrics → Raw filter.
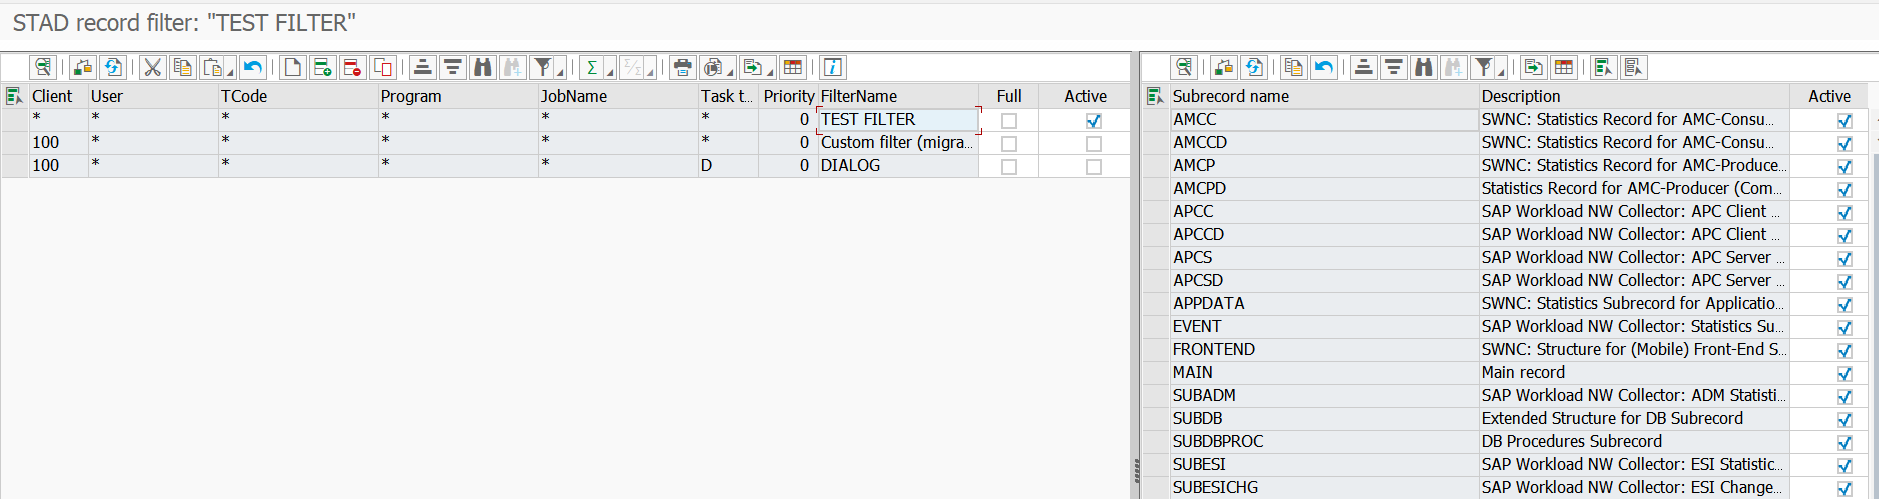
The filter screen is divided into two parts: record filter (on the left) and subrecord selection (on the right).
In order to specify new filter record, following steps are required:
Add new record in the left area and specify filter criteria: client, user, transaction, program, job name and task type. All of these fields do support wildcards. Filter name is free text which is used to specify the purpose of the filter line.
Once the record is created on the left, it is possible to double-click on it and define collected subrecords. Subrecords represent certain measurements like: DB performance, HTTP client performance, RFC server, etc. The list of subrecords is dynamic and depends on your system version. Some systems might have more of them.
Priority column is normally used to collect specific subrecords for narrow filter criteria. For instance, when it is needed to collect DB statistics for some particular program or user. In this case the most specific filter line should have lowest Priority and most generic criteria should have the highest Priority value.
‘Full’ checkbox in the filter line means that sent records should be sent as deep structure. By default all subrecords are sent as separate entries with EVENT_SUBTYPE=<subrecord name>.
'Active' flag is used to deactivate certain filter records, so they are not considered during data extraction.
The filter is used to define records which should be collected. In order to exclude some lines, the solution would be to set lowest Priority and unselect all Subrecords on the right side.