
System Overview
Overview
The PowerConnect App offers an Overview available after the install, where you will be able to check general data and statistics about your SAP systems.
To access the Overview you can navigate to it by clicking the “Overview” tab.
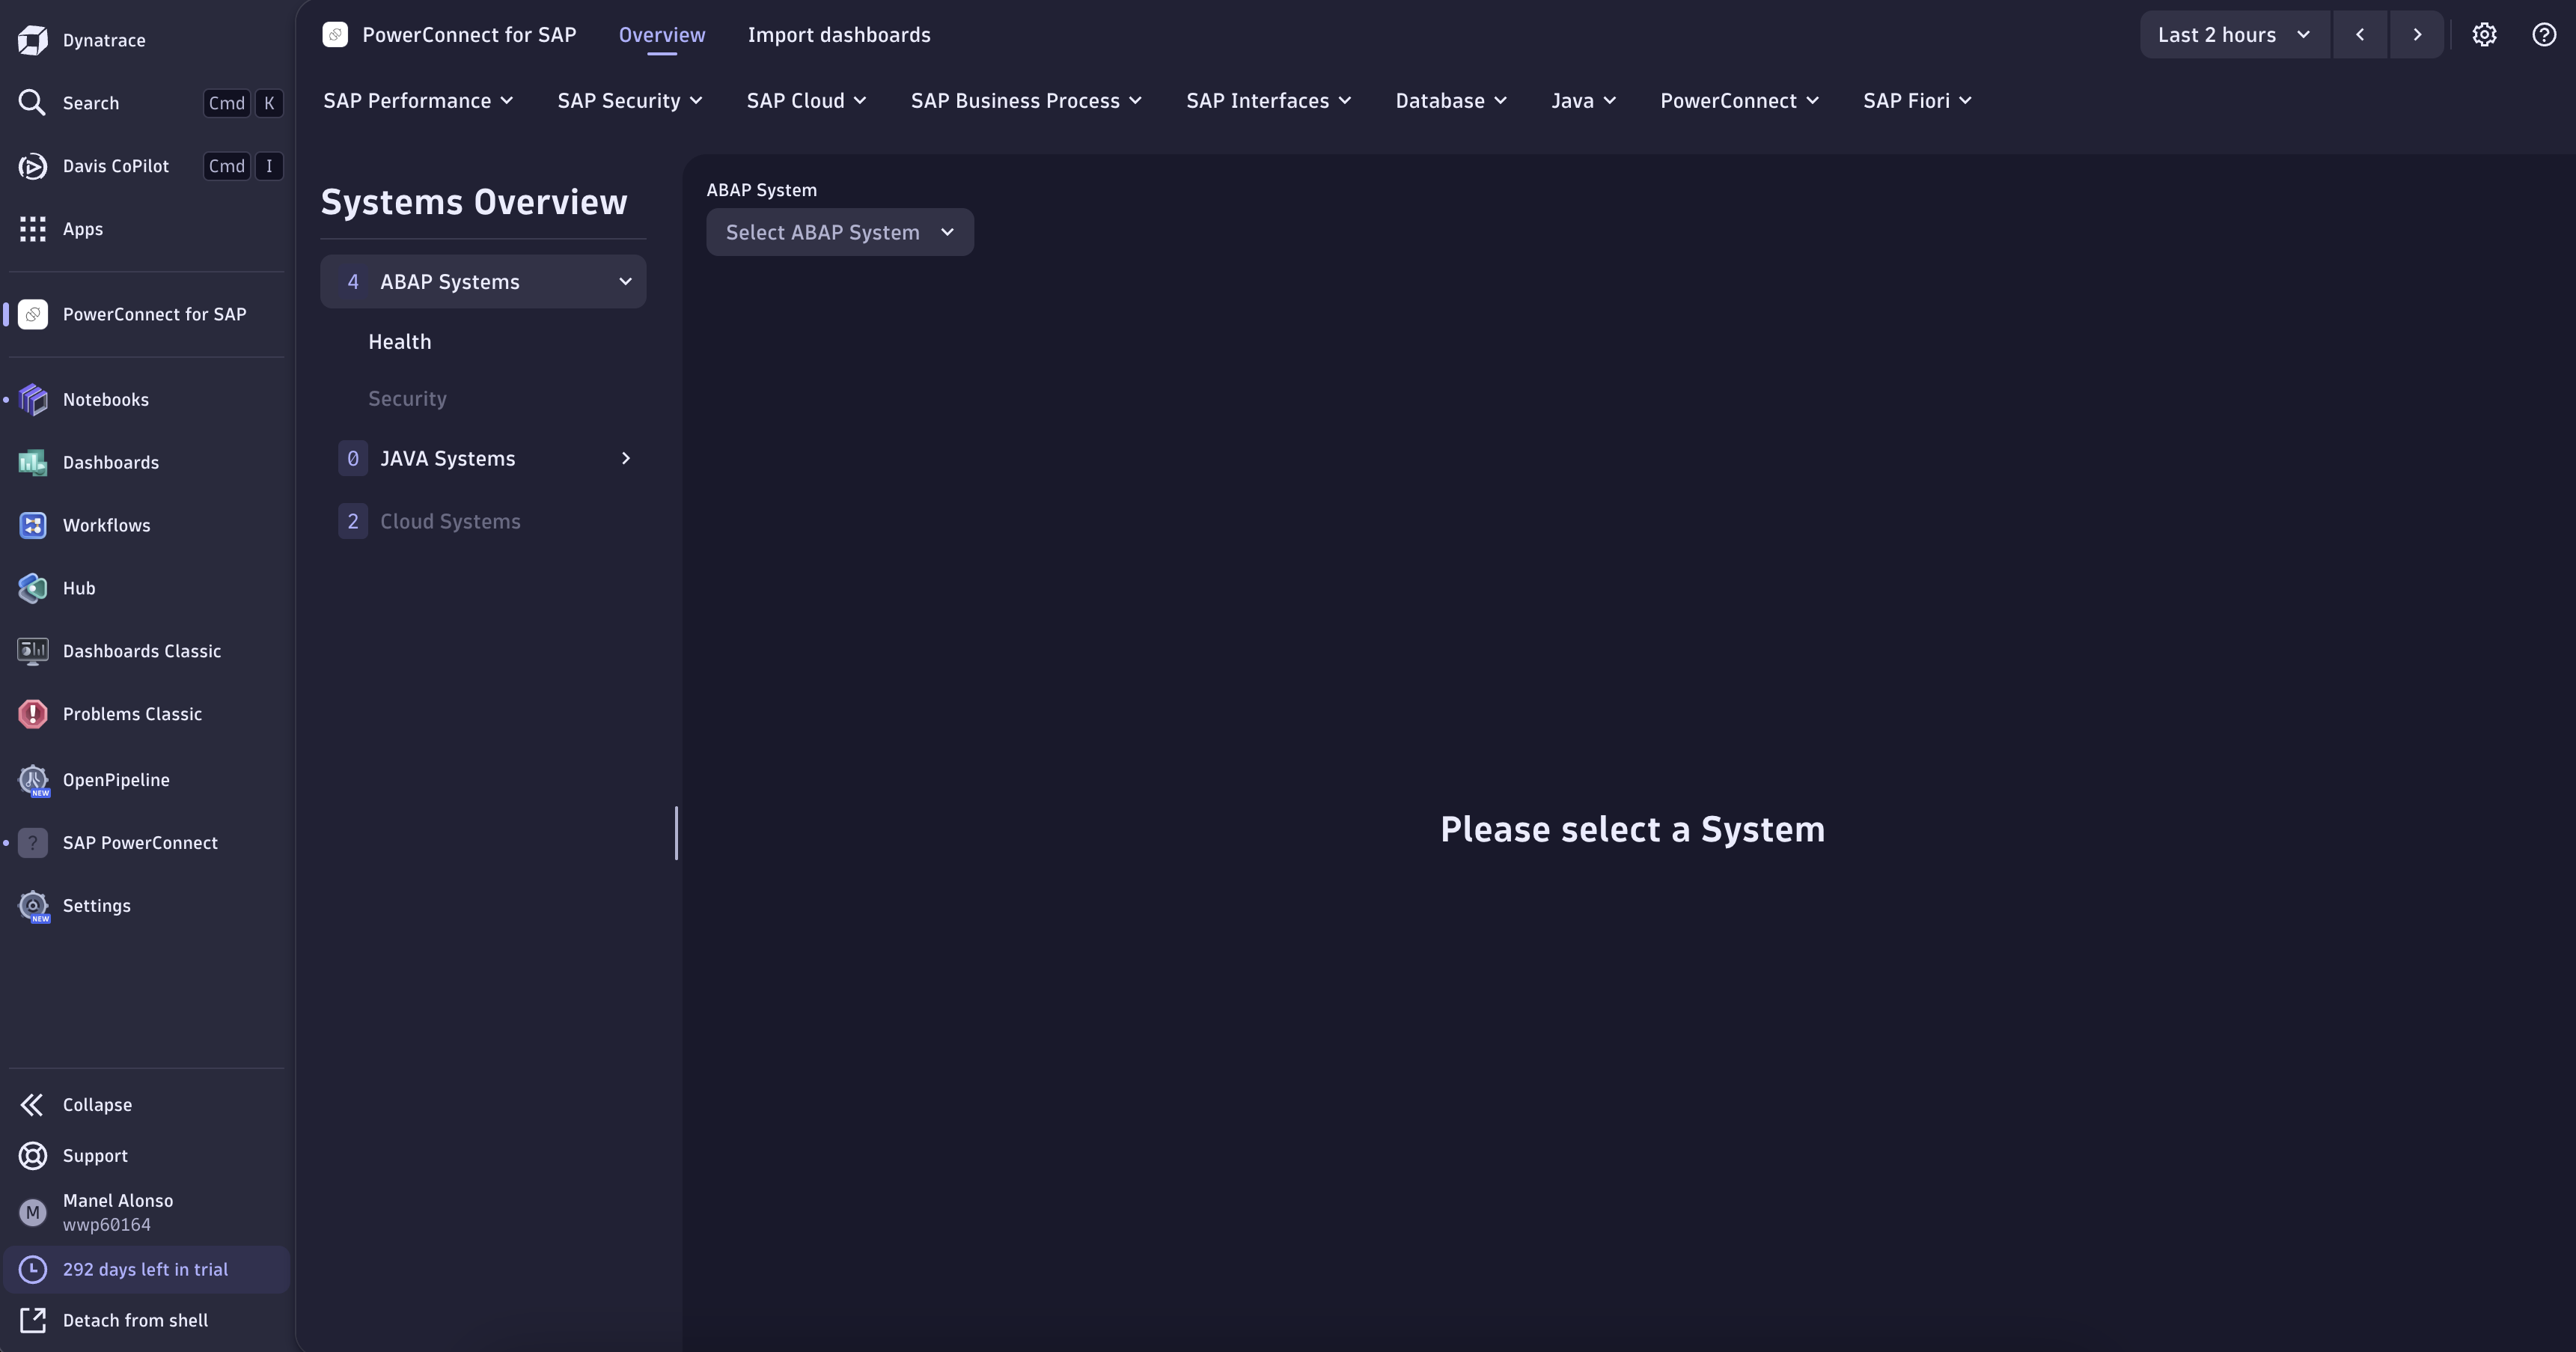
Overview section on the App.
You will see a side panel menu containing our 3 different system types, you can navigate to those by clicking on the menu items, which if available, they will expand showing different sub-categories for that system to look at even more data.
To view the actual data you will first need to select a SAP system. You can do so by clicking on the “Select ABAP System” dropdown and selecting one.
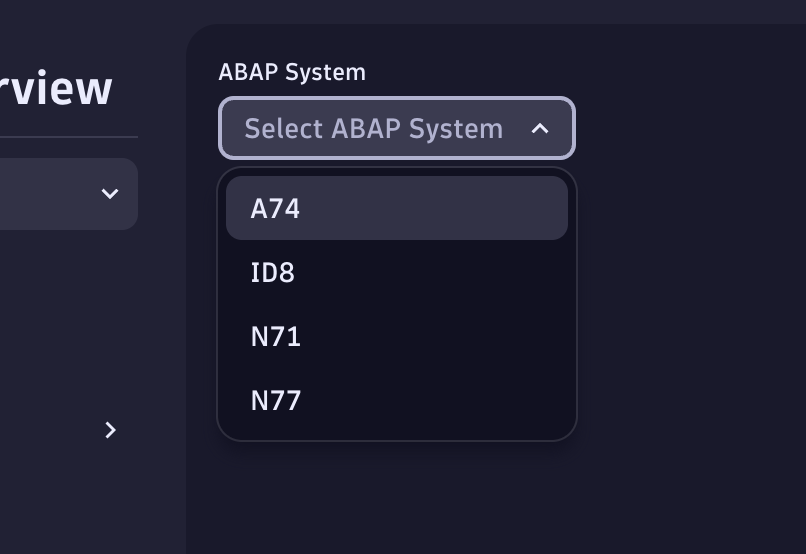
Dropdown for system selection.
Once a system has been selected you will be presented with the overview for that SAP system.
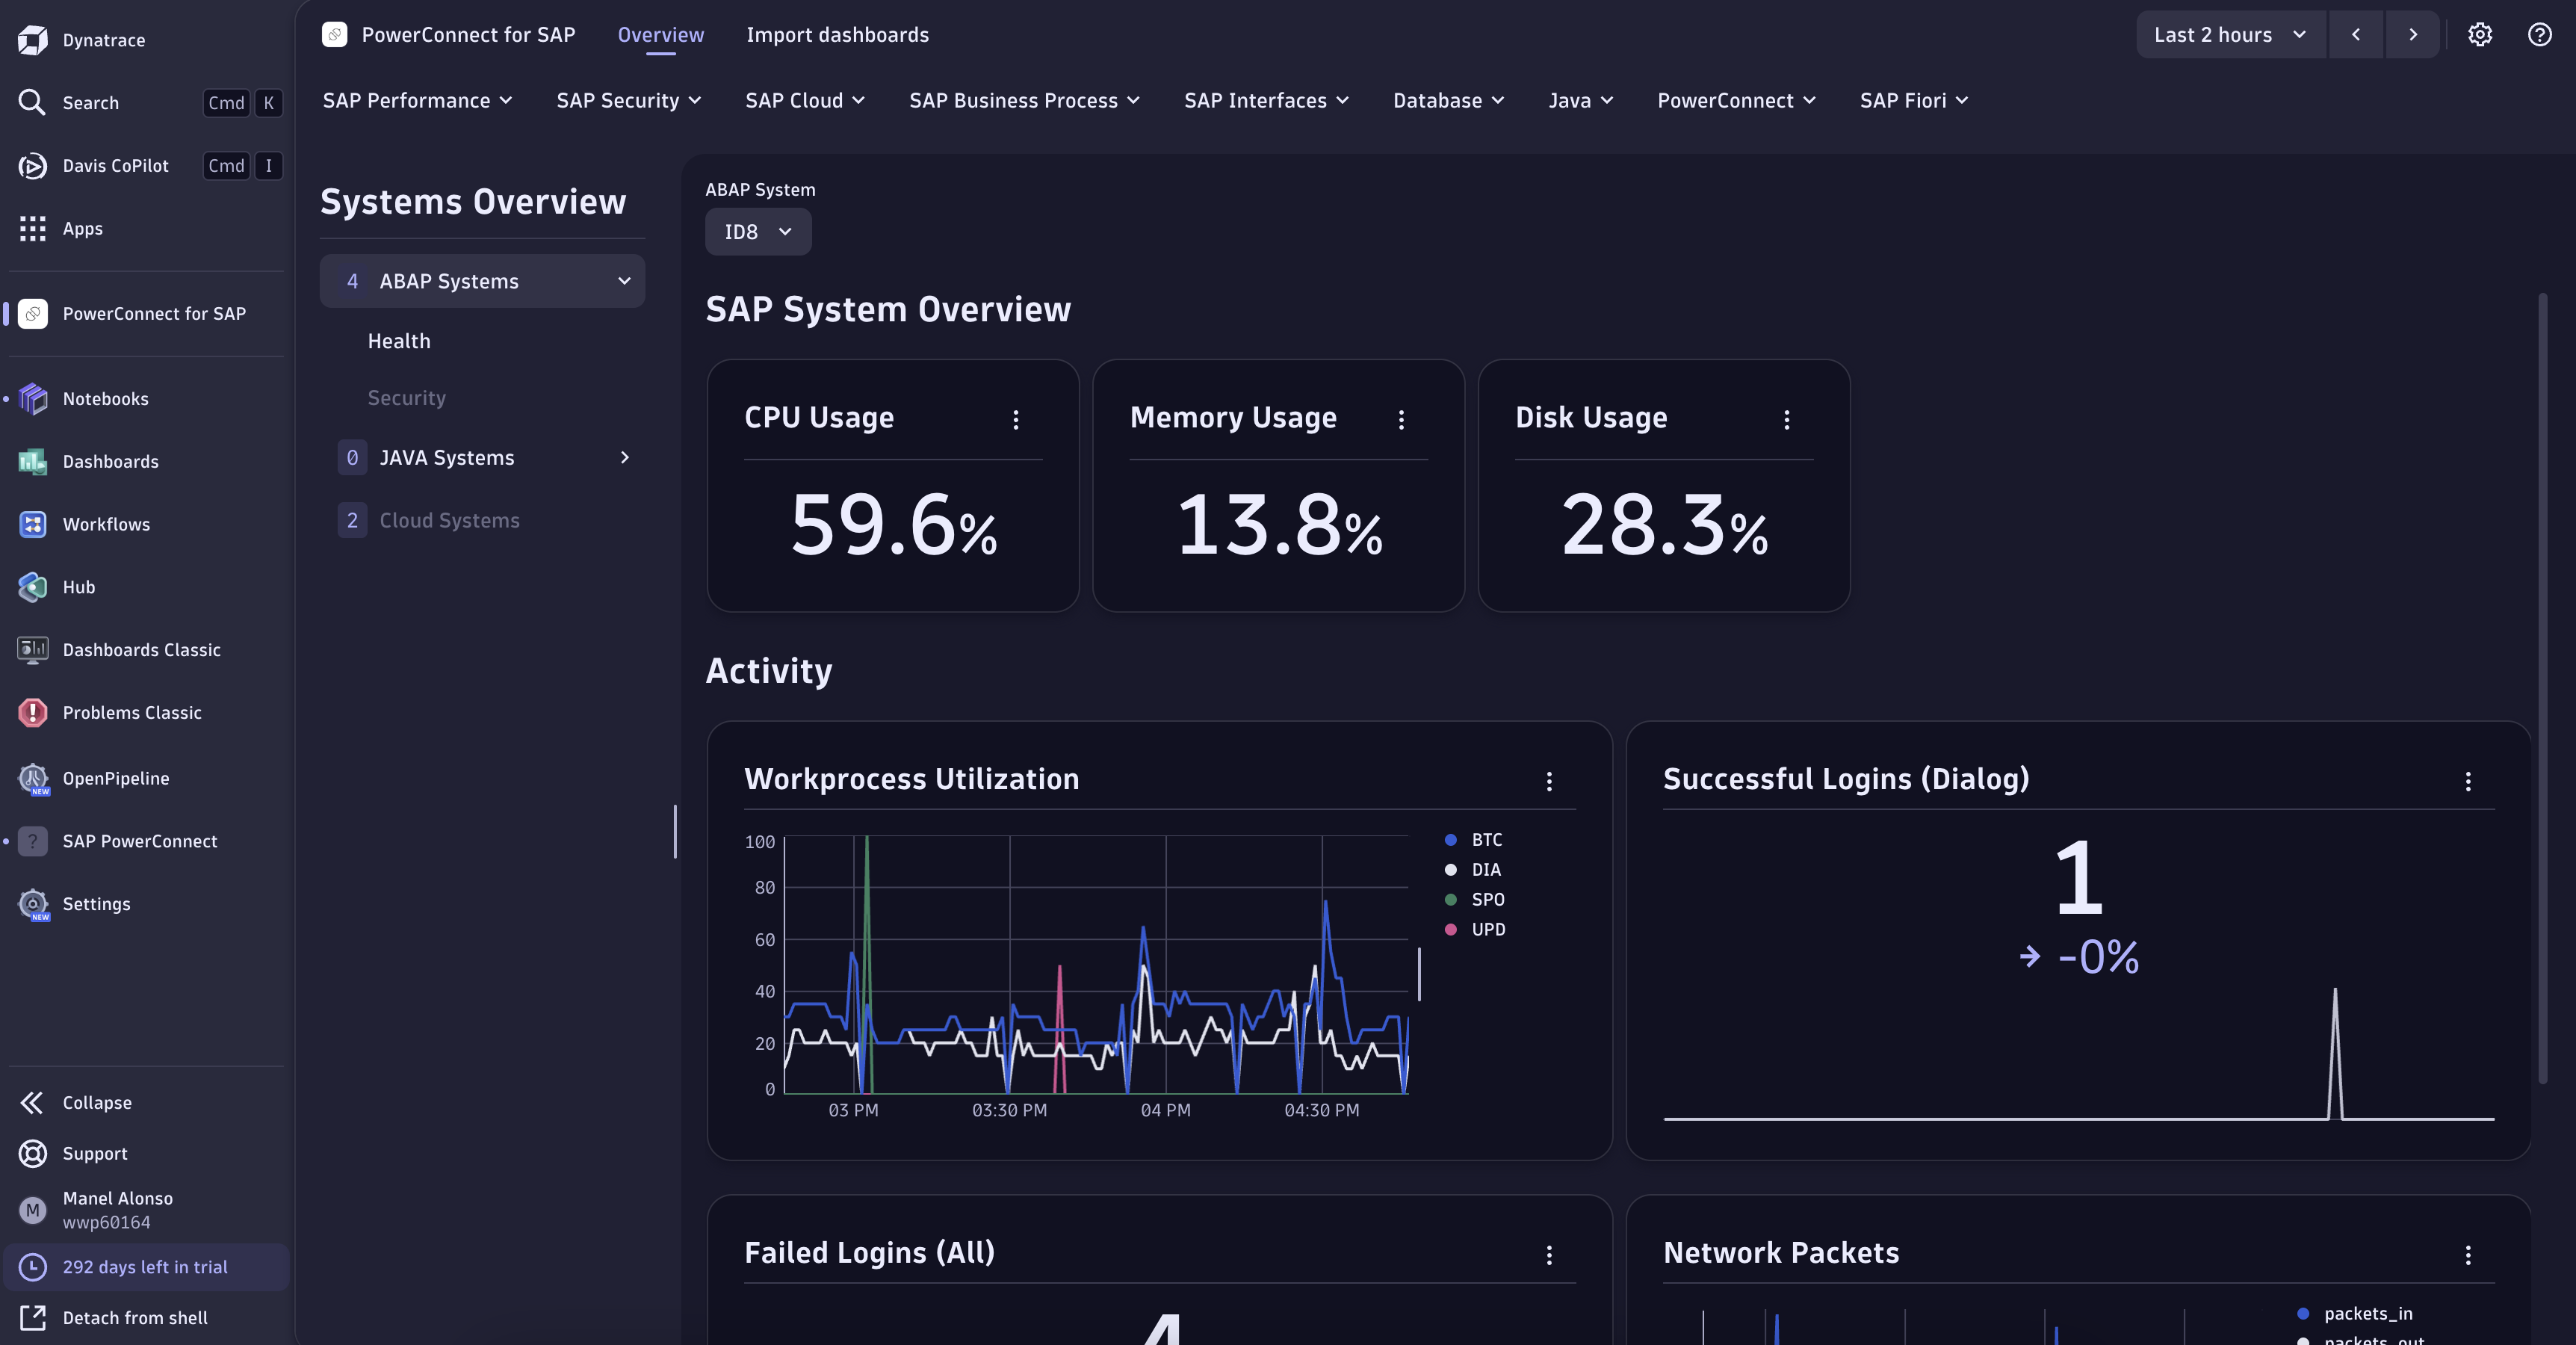
ABAP SAP System Overview.
Navigating to dashboards
To better facilitate finding installed dashboards or available ones, we’ve provided a dashboard navigation menu which is present at the top of the Overview.
In this menu you will find different categories of PowerConnect dashboards containing, once clicked, sub-menu items displaying the available dashboards for that category.
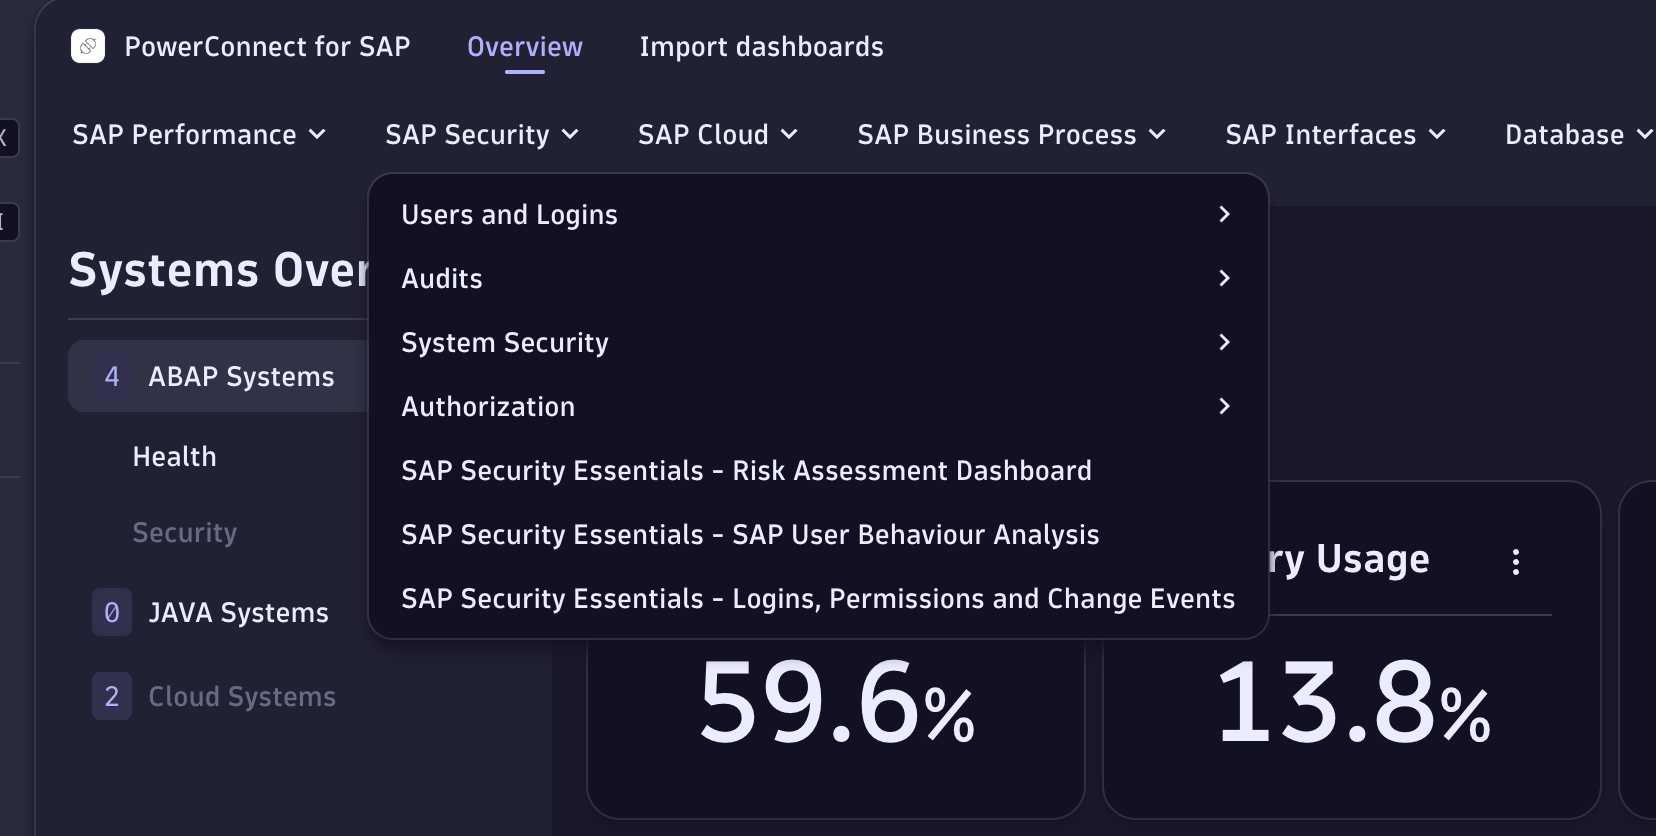
Dashboard navigation menu on the Overview.
If the dashboard is already installed you will find a green checkmark icon next to it. This means that the dashboard is already present on your tenant. Clicking on a dashboard with a green checkmark will take you directly in a new tab to that dashboard.
In case the dashboard does not have a green checkmark, it means it is not yet installed, and once you click on it, you will be presented with the same popup that the Import Dashboards tab has, which will allow you to directly import it with some basic settings. In case those settings are not enough for you, we recommend going to the Import Dashboards tab and import it there, where you will have all of the available settings.
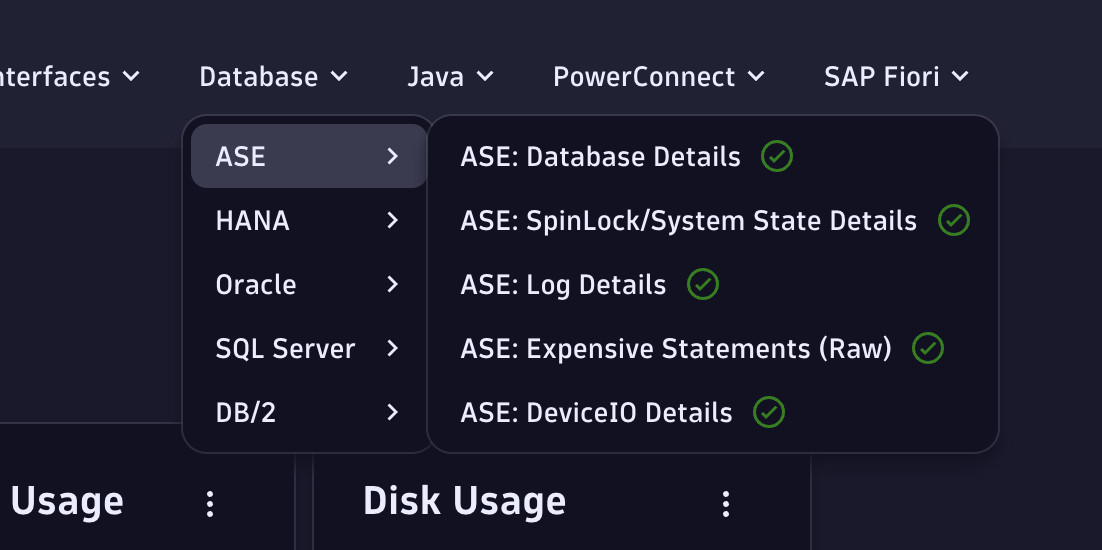
Already imported dashboards on the Overview menu.
Reuse Overview charts on other Dynatrace Apps
Our Overview charts are prepared in a way that you can reuse them on other Dynatrace apps, they are a great starting point in case you want to build your own Dashboards or Notebooks.
To do so, you can click on the 3 dots menu on the right side of the charts, and select the option “Open with”
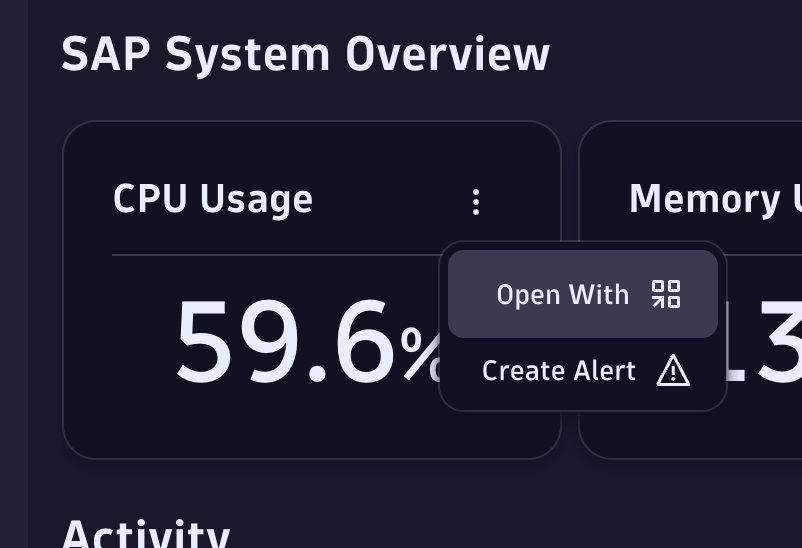
Open with option on an Overview chart.
After clicking on it, you will be presented with a popup asking you to choose where you want to open that chart. You can try different options or the ones that suit your use case.
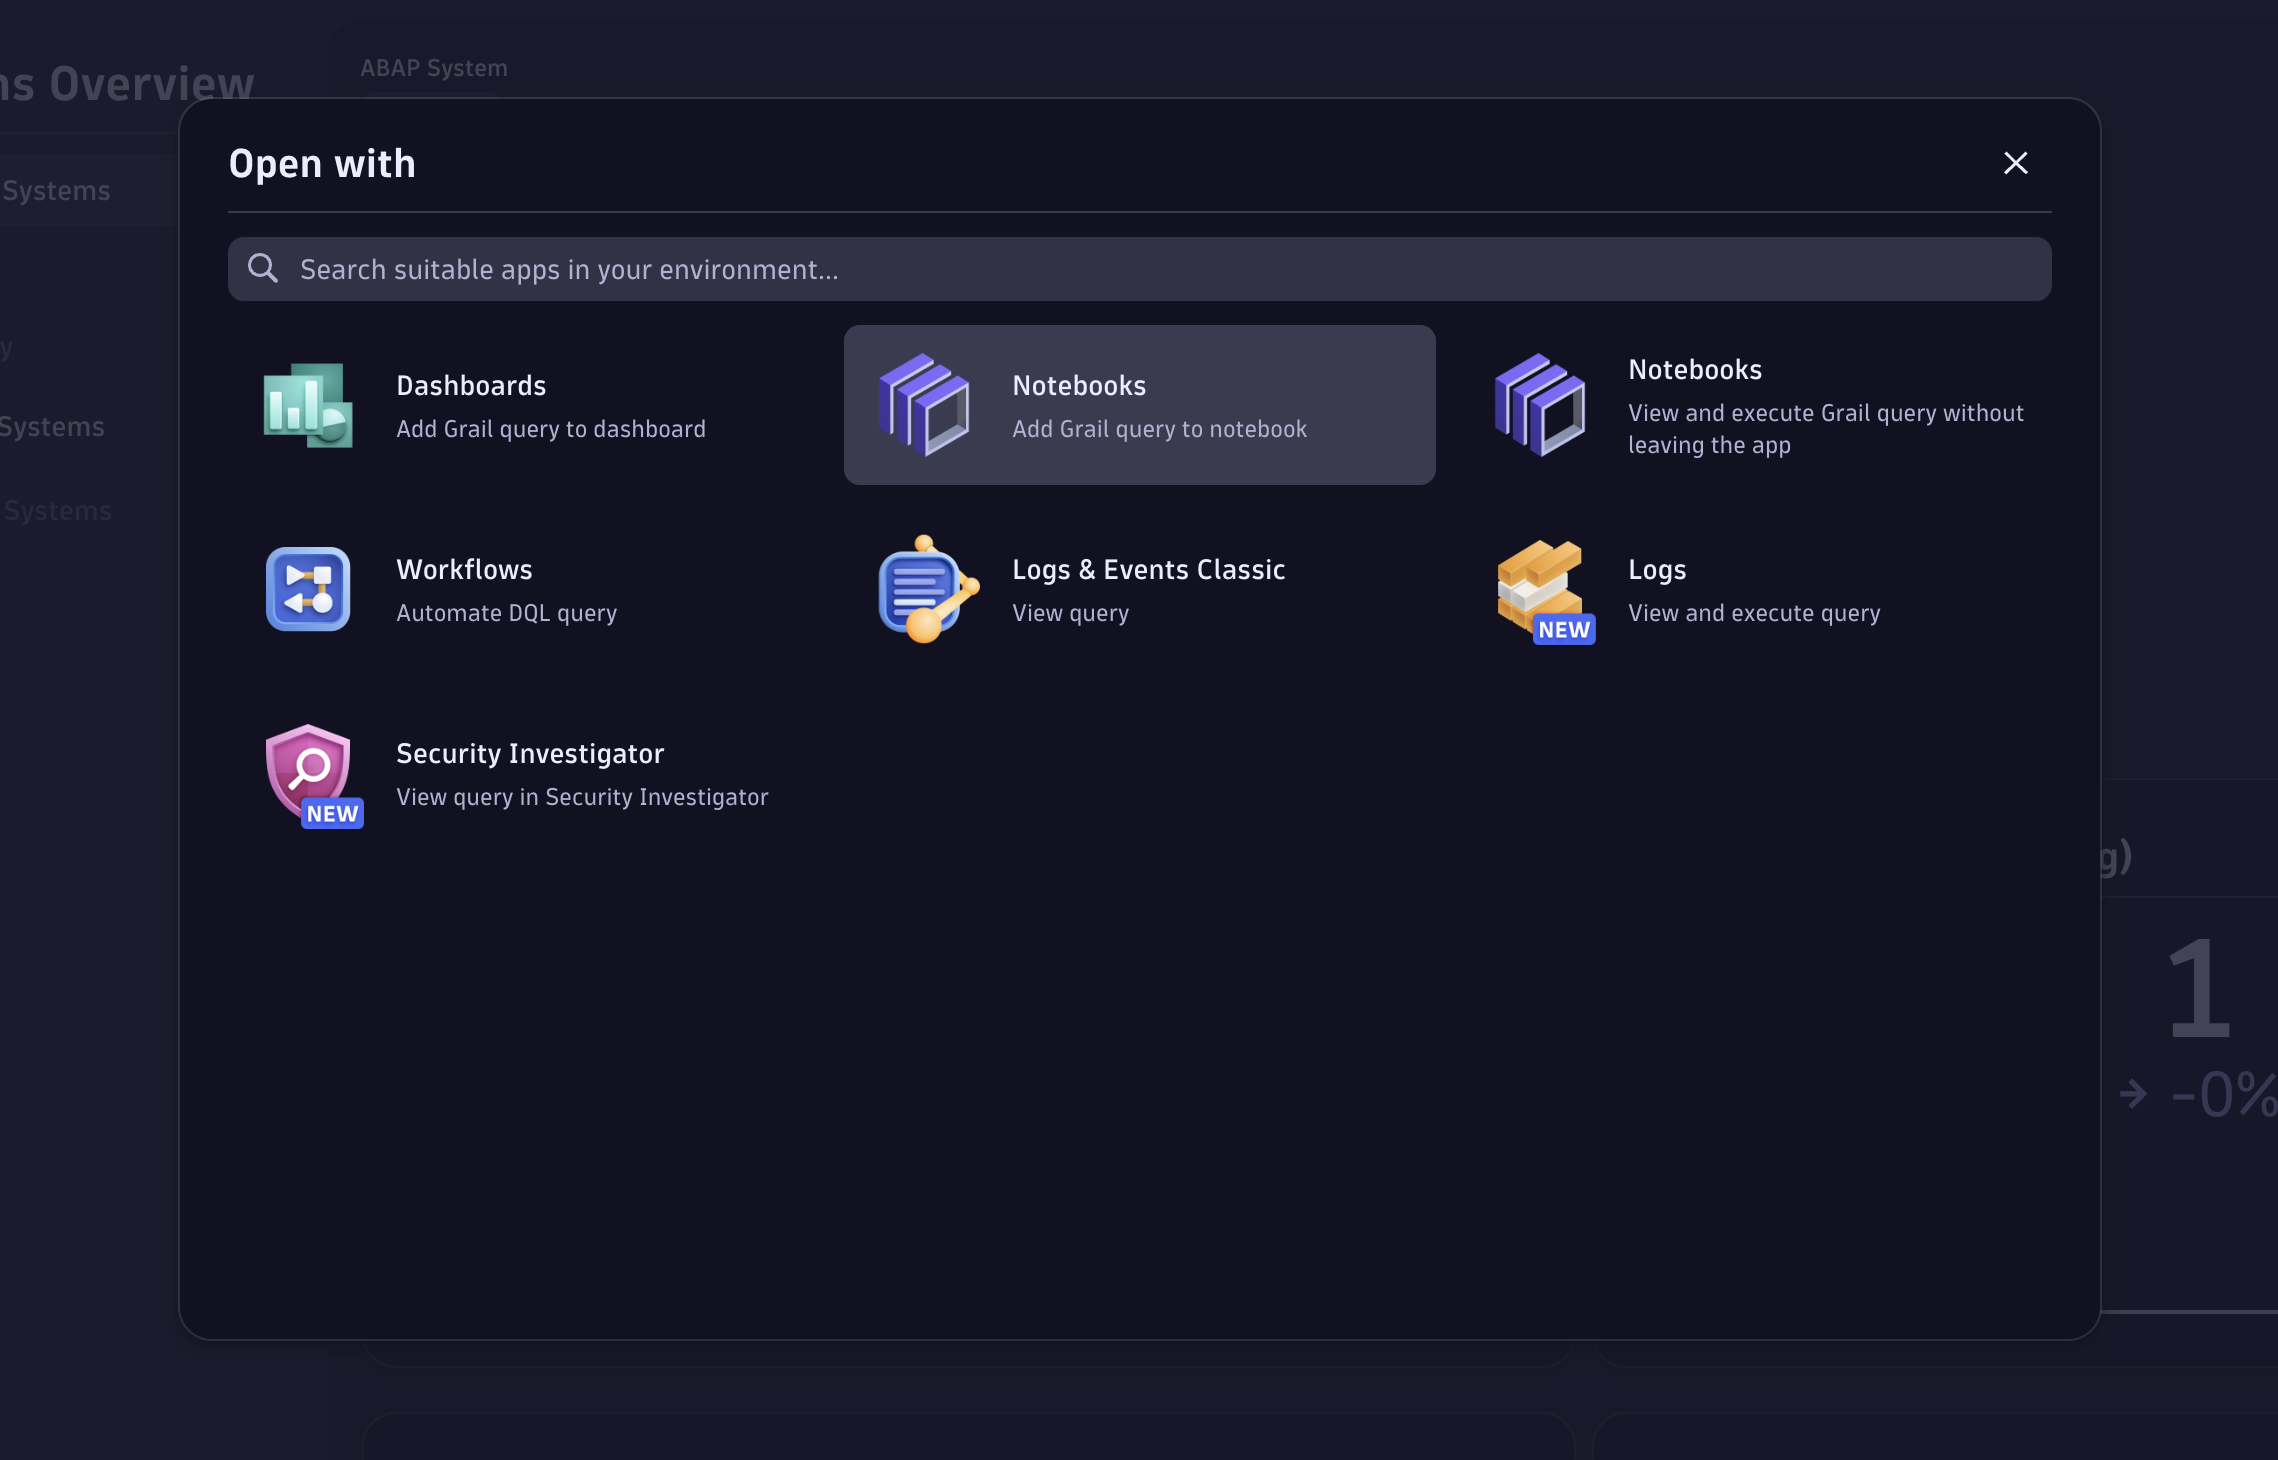
Popup showing the options to open the chart with.