Threads
Data Description
The PowerConnect Java agent is able to extract Java thread execution data SAP system including stack traces. This data can be leveraged for performance monitoring use cases.
Potential Use Cases
This event could be used in the following scenarios:
Alert on blocked/stuck threads
Code level hotspots
Analysing the most resource intensive threads
PowerConnect Administrative Console Configuration
Important: None of the configurations below requires a restart of the PowerConnect agent.
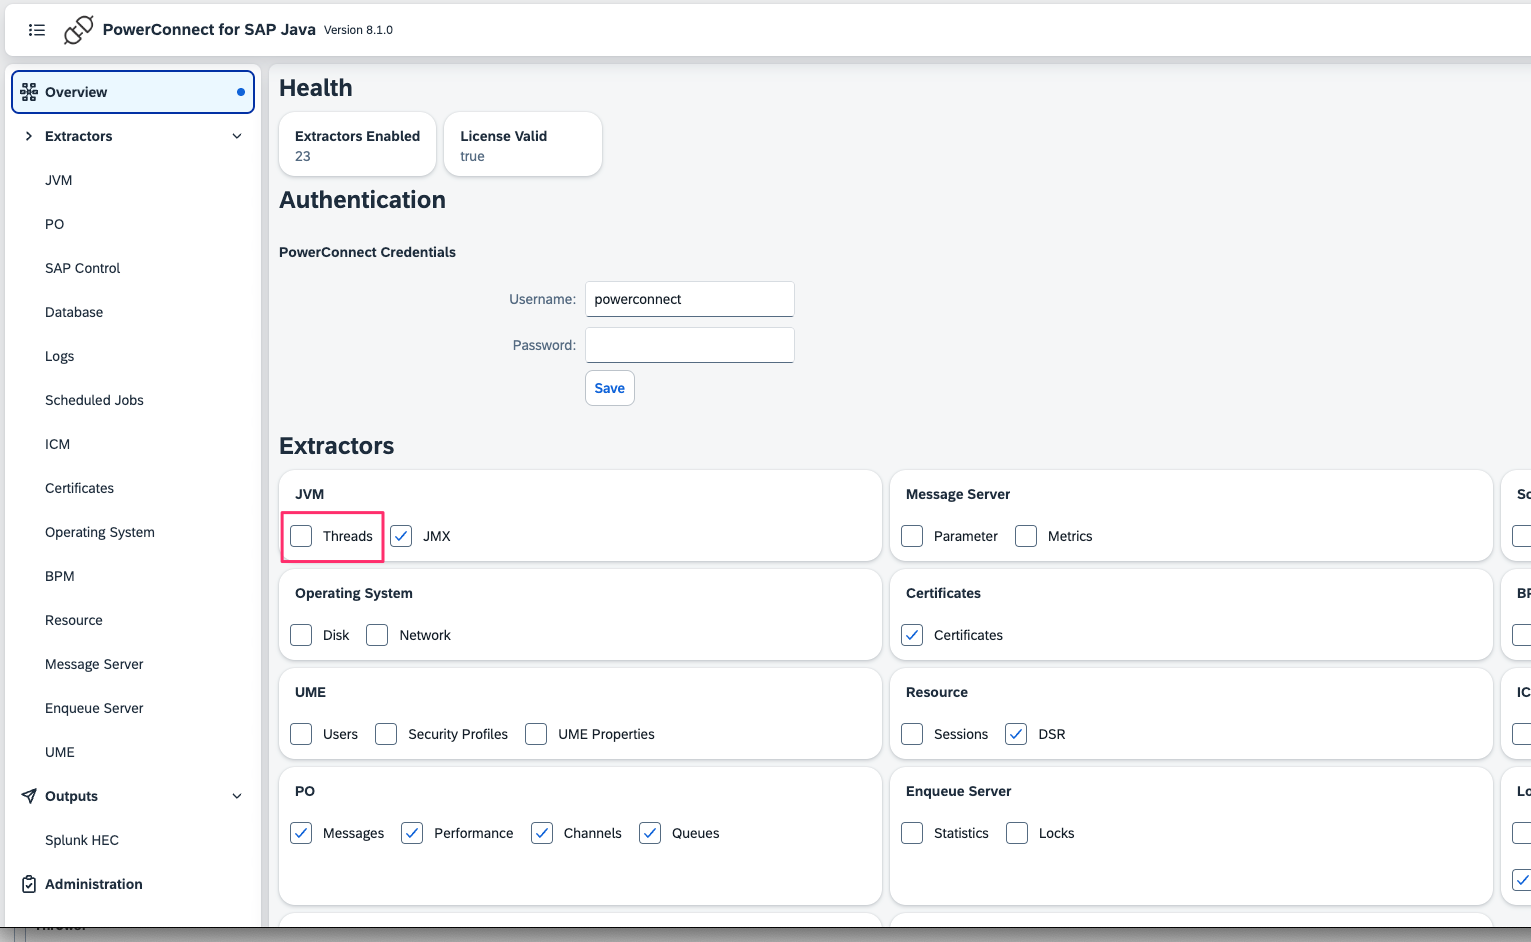
Login to the PowerConnect administrative console via the following URL (http://<serverhost>:<port>/powerconnect-java/index.html).
Then click on the Overview tab on the left. The screen will look like the screenshot below. Ensure that Threads is checked and click Save.
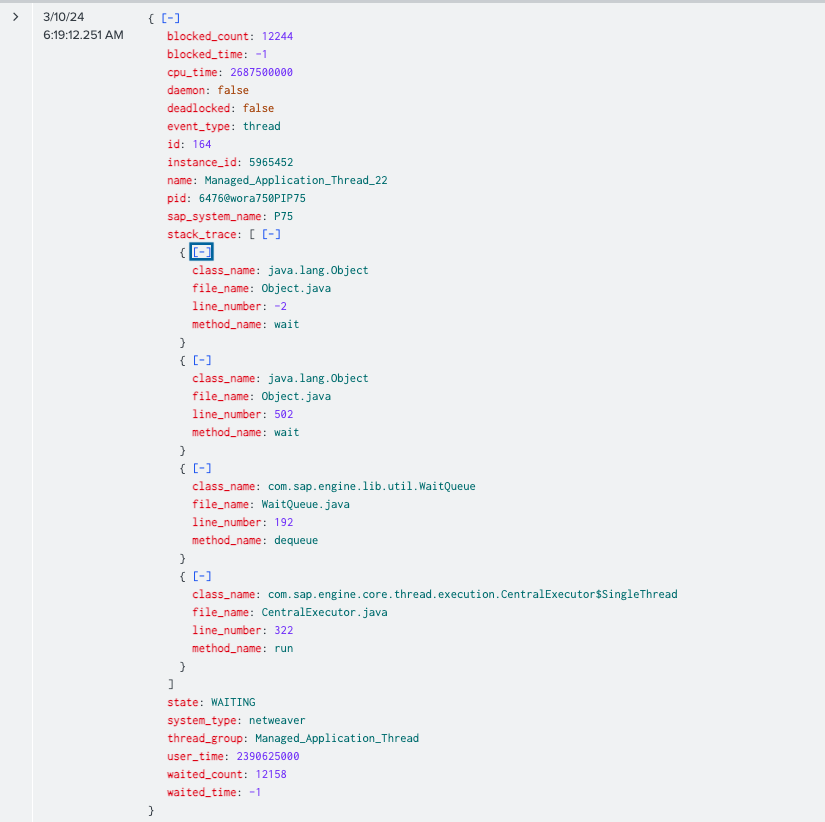
Event
The event will look like this:
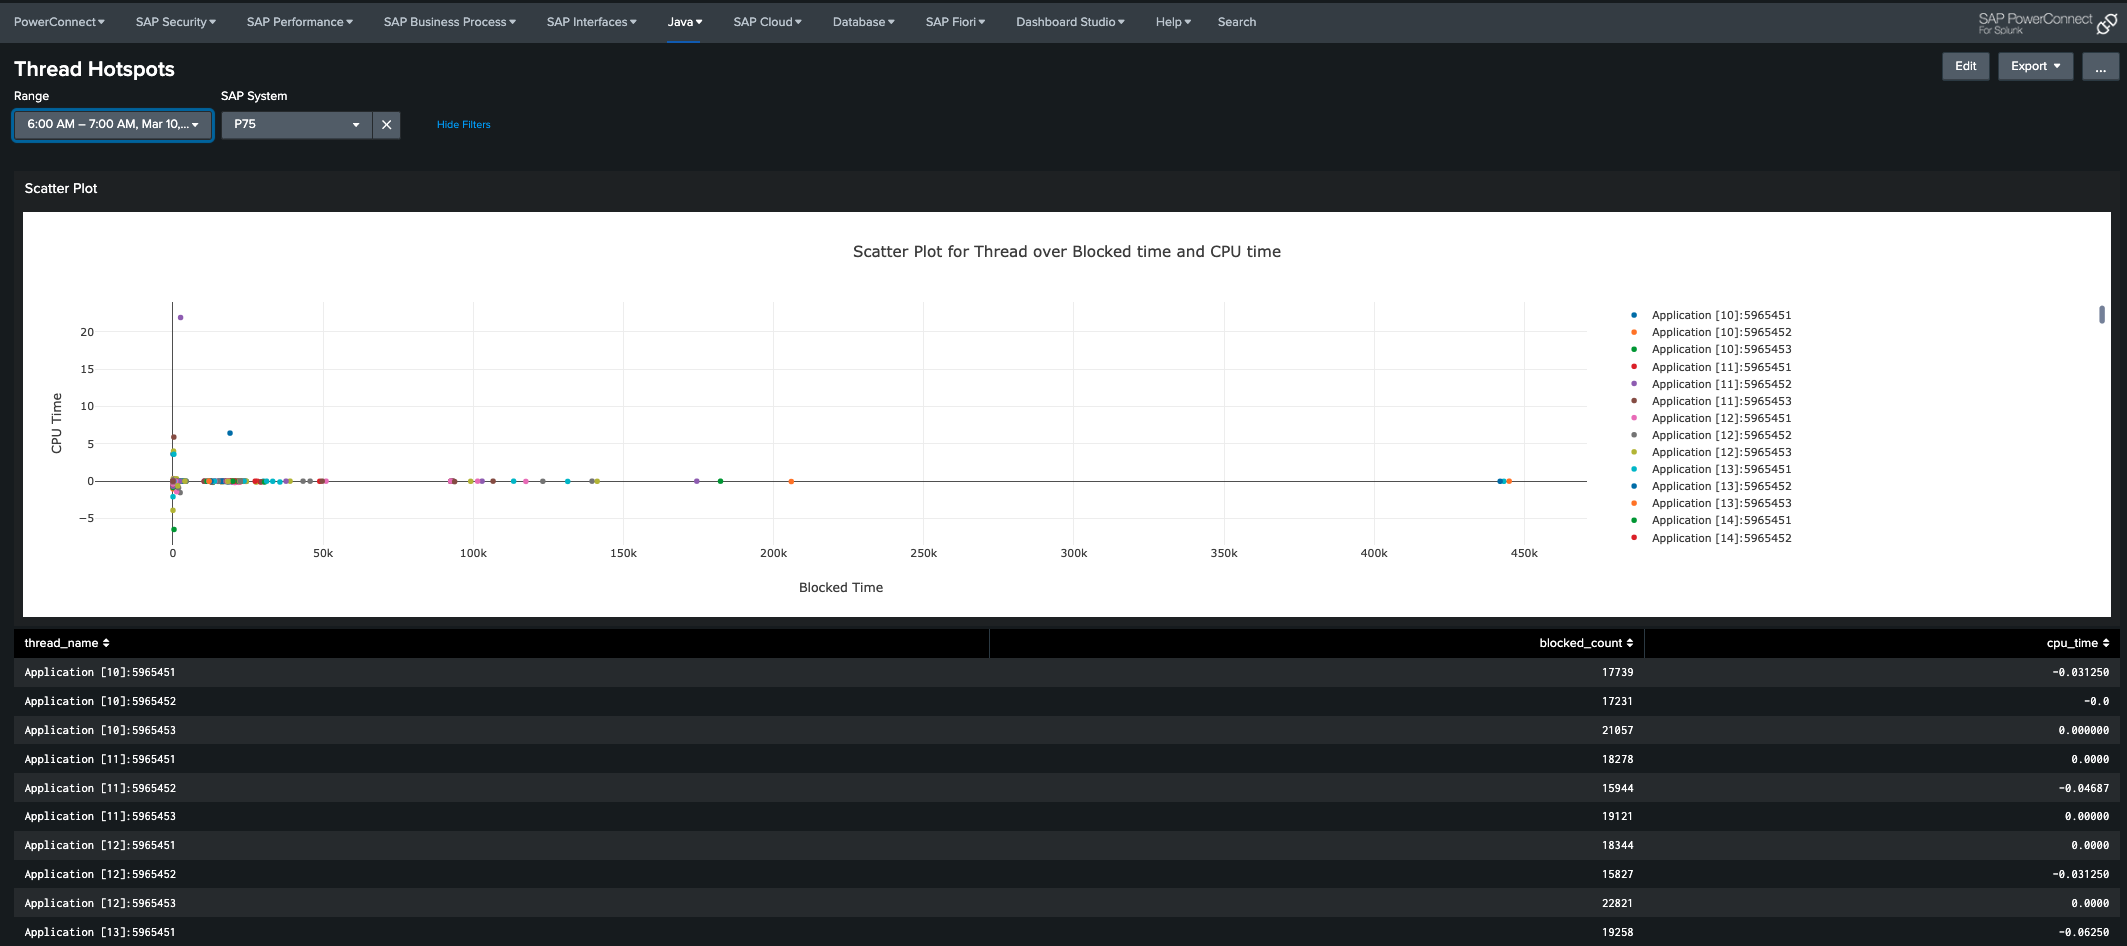
There is an out of the box Splunk Dashboard available in the PowerConnect Splunk app:
Open the PowerConnect Splunk app
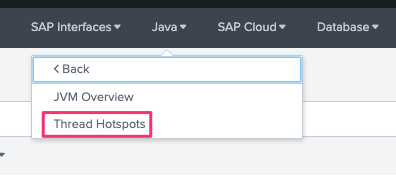
In the navigation bar click Java → JVM → Thread Hotspots
The dashboard will be displayed