Configuring Splunk Observability Cloud Connection in PowerConnect (PowerConnect ABAP 8.X)
Configuring Splunk Observability Cloud Connection in PowerConnect
Category: Information | Priority: Normal |
|---|---|
Platform: ABAP | Version: 1 from 01.07.2024 |
Description
Starting from PowerConnect 8.02, it is possible to send OpenTelemetry traces to Splunk Observability Cloud. At the moment it requires NW 7.50+ or S/4HANA platforms to collect necessary data.
!Please note, that Splunk Observability Cloud does not accept OpenTelemetry Logs/Events, thus this connection will only send traces and metrics (SP 8.03+). In order to receive regular events Splunk Enterprise/Splunk Cloud is required. In order to route logs to Log endpoints and Traces to trace endpoints manual filter setup is required.
Please ensure all endpoints have appropriate filters assigned as described below.
Following steps needs to be performed to get it setup:
Upload Splunk Observability certificate into STRUST.
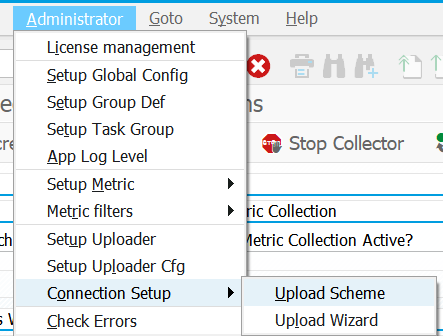
Administrator->Connection Setup->Upload Scheme
On the right side of the screen press Create Splunk Obs. endpoint

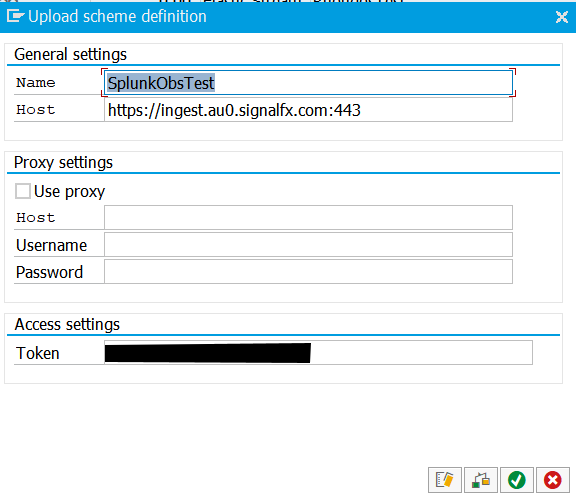
Populate connection details
Check the connection
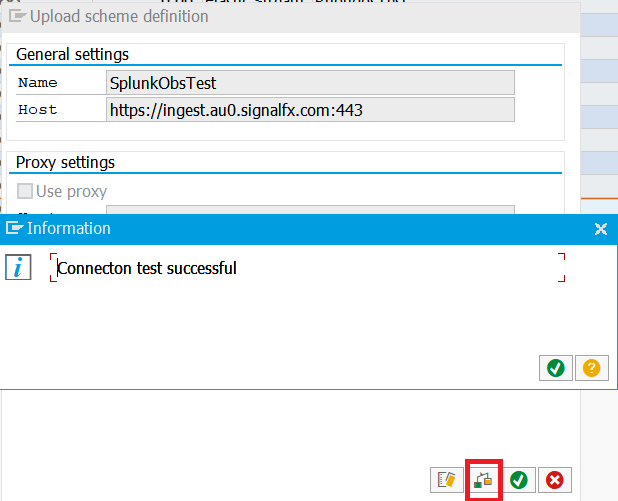
In case error message is shown, troubleshooting might be required to ensure outbound connectivity is allowed and SSL is setup properly.
(SP 8.02 Only) Define Group Def uploading filters to create ZTRACE_ONLY and ZLOGS_ONLY filters
Drag and drop the endpoint from the right side of the screen to the Default Scheme node on left side of the screen. Set the Active flag as shown below:
For PowerConnect SP 8.02: Filter is ZTRACE_ONLY (created on step #6 of this guide)
For PowerConnect SP 8.03+: Filter is $KIND_TRACE_ONLY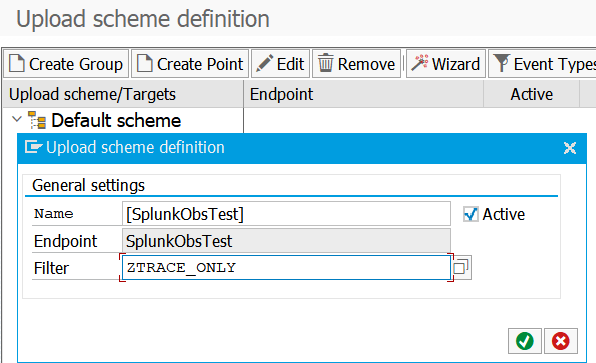
(Filter definition is not required starting from SP 8.03)
(SP 8.02 Only) Double-click on all existing Log endpoints and assign the ZLOGS_ONLY filter to filter out trace data
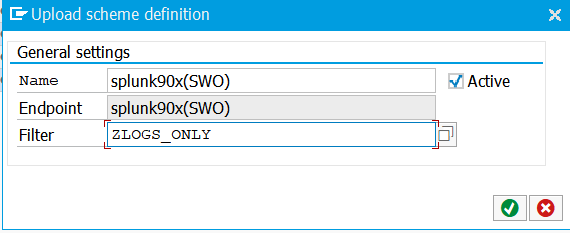
Filter definition is required only for PowerConnect version SP 8.02!
Confirm the dialog and Save changes.
Activate the trace data source extractor in Administrator->Setup Group Def menu option as described here: KB 108 - Enable/Disable ABAP Extractor
Following trace sources are supported (only one needs to activated):
- STATS_TRACE extractor (in systems where STATS tcode is available). Recommended SAP_BASIS 7.51+
- STAD_TRACE extractor (for systems <=7.50)
