
Release Notes for Splunk App v6.6.0
Release Date
28th Jun 2021
Install Steps
PowerConnect Splunk App Installation
Upgrade Steps
PowerConnect Splunk App Upgrade
Release Notes
New
New! Work Process Detailed Analysis
New! BPM IDOC To Business Object Relationship
New! Outbound Delivery Monitor
New! UME for ABAP
New! SAP Read Access Login (SRAL)
New! SAP RZ10 Profile Parameters
New! ST22 Dump Details
New! NetWeaver Java: DB Connection Statistics
New! NetWeaver Java: Distributed Trace
New! NetWeaver Java: Locks
New! NetWeaver Java: Process Information
New! NetWeaver Java: User Sessions
New! NetWeaver Java: Web Sessions
Updated/Changes
Updated! System Overview
Updated! Landscape Overview
Updated! Extractor Status
Updated! Time Machine Dashboard
Updated! SAP Buffers by Instance
Updated! CPU vs. Work Processes
Updated! SM13 Updates
Updated! Abap Dumps
Updated! Batch jobs
Updated! NetWeaver Java: UME
Updated! SAP Cloud - CPI Message Monitoring
Updated! HANA: Configuration Mini-checks
Updated! ICM Monitoring dashboard
Removed
Removed! SM50 Trace by Instance (obsolete)
Known issues
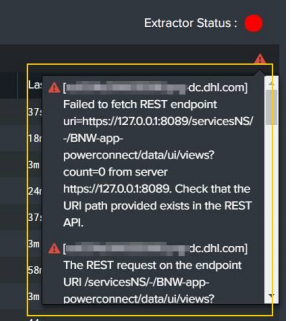
In case of a clustered or distributed Splunk environment consisting of indexer(s), the following error (as shown in the below image) would be seen in the dashboard. The search results obtained would still be accurate. Kindly follow KB 117 - REST Endpoint error on Splunk Distributed Environment to fix this issue
More details on Updated/Changes
System Overview
Added EVENT_SUBTYPE="" for ST22 queries
Changed drilldown in time charts (Availability(%), RAM(%) and Memory(%) and WP type), to show normal query instead of tstats
Landscape Overview
Added EVENT_SUBTYPE="" for ST22 queries
Changed drilldown in “Memory Utilization %”, “Event Index Time Lag”, “CPU Utilization %”, “Work Process Utilization %”, “Response time (max)”, “Availability” and “Availability Chart” to show normal query instead of tstats
Extractor Status
Updated he extractor status symbol to take time range as follows: Latest time would be the latest time selected from the Time Range filter in the dashboard. Earliest time would be 24 hours less than the latest time.
Added “No Info Available” option in status filter and in table replace N/A to “No Info Available”.
Optimized the query.
Time Machine Dashboard
Added EVENT_SUBTYPE="" for ST22 queries
Changed drilldown in “CPU/RAM vs. Time”, “Executed Batch Jobs vs. Time”, “STAD (DB time, resp time, network time) vs. Time, Work Process Utilization % vs. Time” and “Number of Logged In Users vs. Time” panel to show normal query instead of tstats
SAP Buffers by Instance
Added link “View Profile Parameters” which drilldowns to “SAP RZ10 Profile Parameters” dashboard.
Added new panels - “Swap Space Per Buffer” and “Used Space per Buffer”.
Added drilldown to open new search tab for all the panels
CPU vs. Work Processes
Added EVENT_SUBTYPE=""
Added drilldown from WP PID to show CALLSTACK
Added red color to show error
Added link to open “SAP Logs Search” dashboard when no results are found on drilldown from WP Number to show SM51 Logs.
SM13 Updates
Updated dashboard name from “Updates” to “Dashboard Updates”
Added panel at top to show “Overview of Update Servers”
Added “Update Requests” panel
Added in-panel drilldown from “Updates” and “Oldest Update” charts.
Converted units from Minutes to Hours in Oldest Update chart
Abap Dumps
Added EVENT_SUBTYPE="" and dedup
Added two new panels - “Top 10 Dumps” and “ABAP Dumps by Category”
Batch jobs
Added EVENT_SUBTYPE="" in SM51 queries
Added drilldown in “Average Execution Time”, “Maximum Execution Time” panel.
NetWeaver Java UME
Added new panels - User validity expiring soon (in 30 days) and User validity expired recently (past 30 days) panel with drilldown
SAP Cloud - CPI Message Monitoring
Fixed logs filter and drilldown.
HANA: Configuration Mini-checks
Renamed Dashboard name from Hana: Custom Scripts.
Added * in the query FLTNAME=HANA_CONFIGURATION_MINICHECKS_*
Removed “SM50 Trace by instance” Dashboard.
ICM Monitoring dashboard
Fixed drilldown from "Thread ID" column of table which shows Logs for a particular Thread ID
Other minor improvements
All dashboards - Updated version=”1.1” in <form> or <dashboard>.
SAP logs Search - Added “Instance name” filter and and the filters would not get reset when System filter is changed to support drilldown functionality from “CPU vs Work process” dashboard.
SAP RZ10 Comparison - Changed the fields in drilldown table
SAP Directories - Added “No information in the selected time range” in “Last Modified Before” column when the cell is empty. Changed “File Name” filter to open text.
ST03 - User Profile - Added filter for User, Jobname, Report Name
Added EVENT_SUBTYPE="" in “Work Processes” and “Work Processes by Instance” dashboard