Data Description
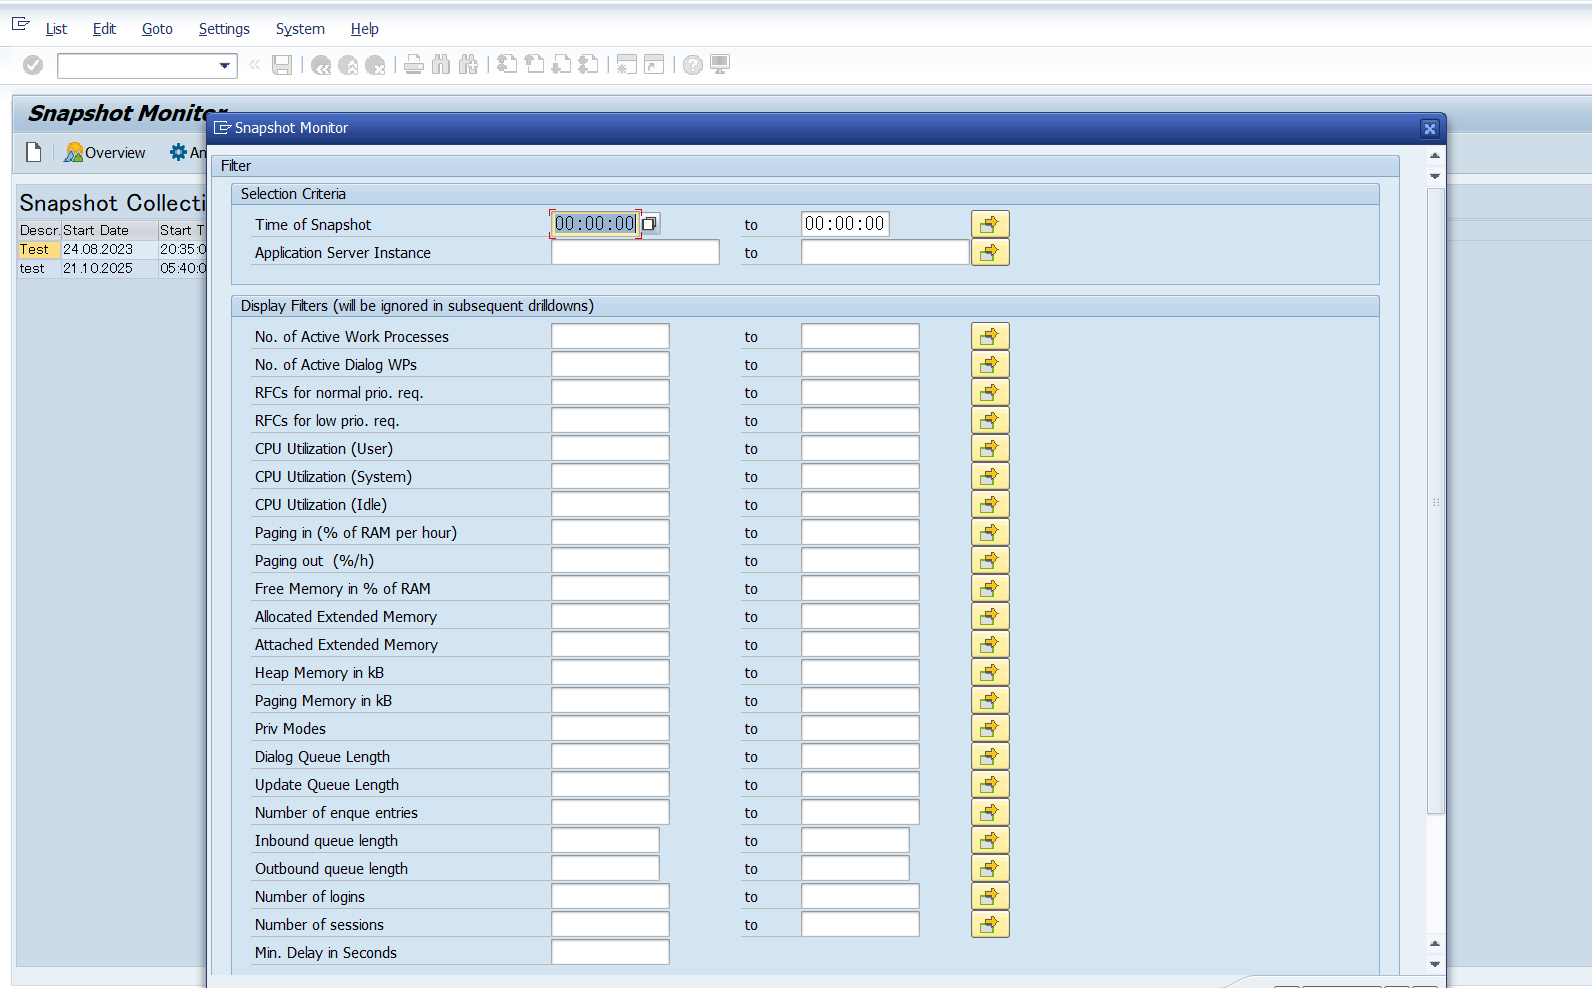
The SDF_SMON event corresponds to the /SDF/SMON transaction in the SAP system. It is the modern, recommended version of the snapshot monitoring tool, replacing the older SDF_MON (transaction /SDF/MON). Designed for SAP NetWeaver 7.4 and higher, SDF_SMON offers enhanced performance monitoring capabilities compared to its predecessor. It collects a broader and more detailed set of system performance metrics, including CPU usage, memory utilization, number of work processes, active sessions, logins, and request queue statistics. In addition to being more comprehensive, SDF_SMON is also more efficient, making it the preferred tool for analyzing system snapshots in real time.
Potential Use Cases
This event could be used in the following scenarios:
-
Analyze if the load is equally distributed across all SAP application servers by analyzing the CPU utilization
-
Analyze memory utilization including heap memory at specific times when the CPU utilization was high.
-
Analyze SAP active work process & work process utilization
-
SMON includes the back-end session key used to uniquely identify each session (user mode) in the system,. This allows us to profile and track dialog steps across roll-outs and roll-ins when the user session does not roll back into the same WP (i.e. the WP number changes).
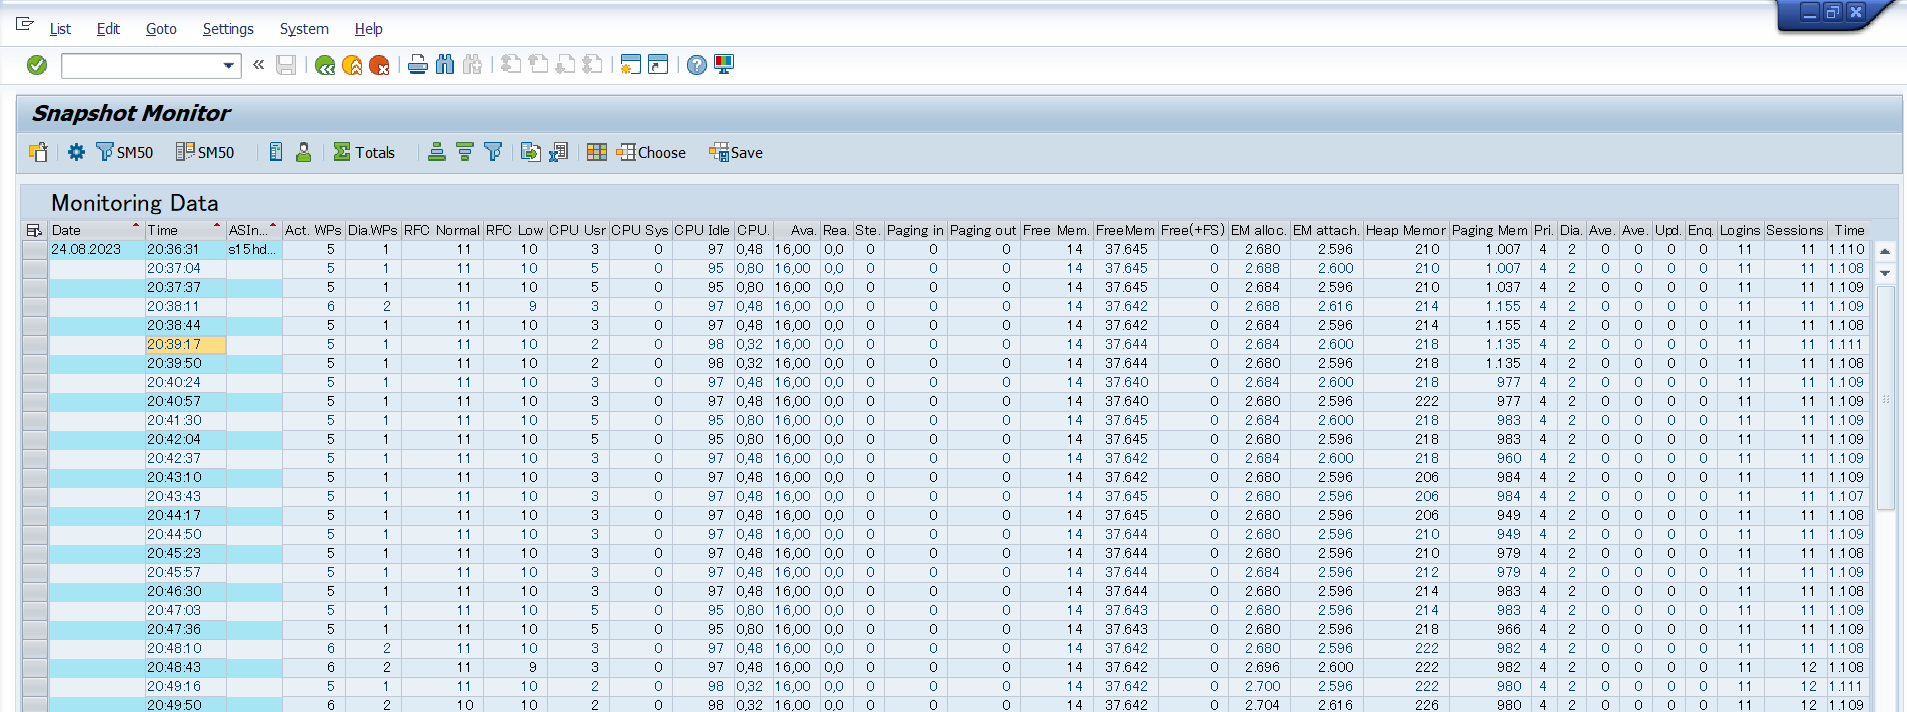
SAP Navigation
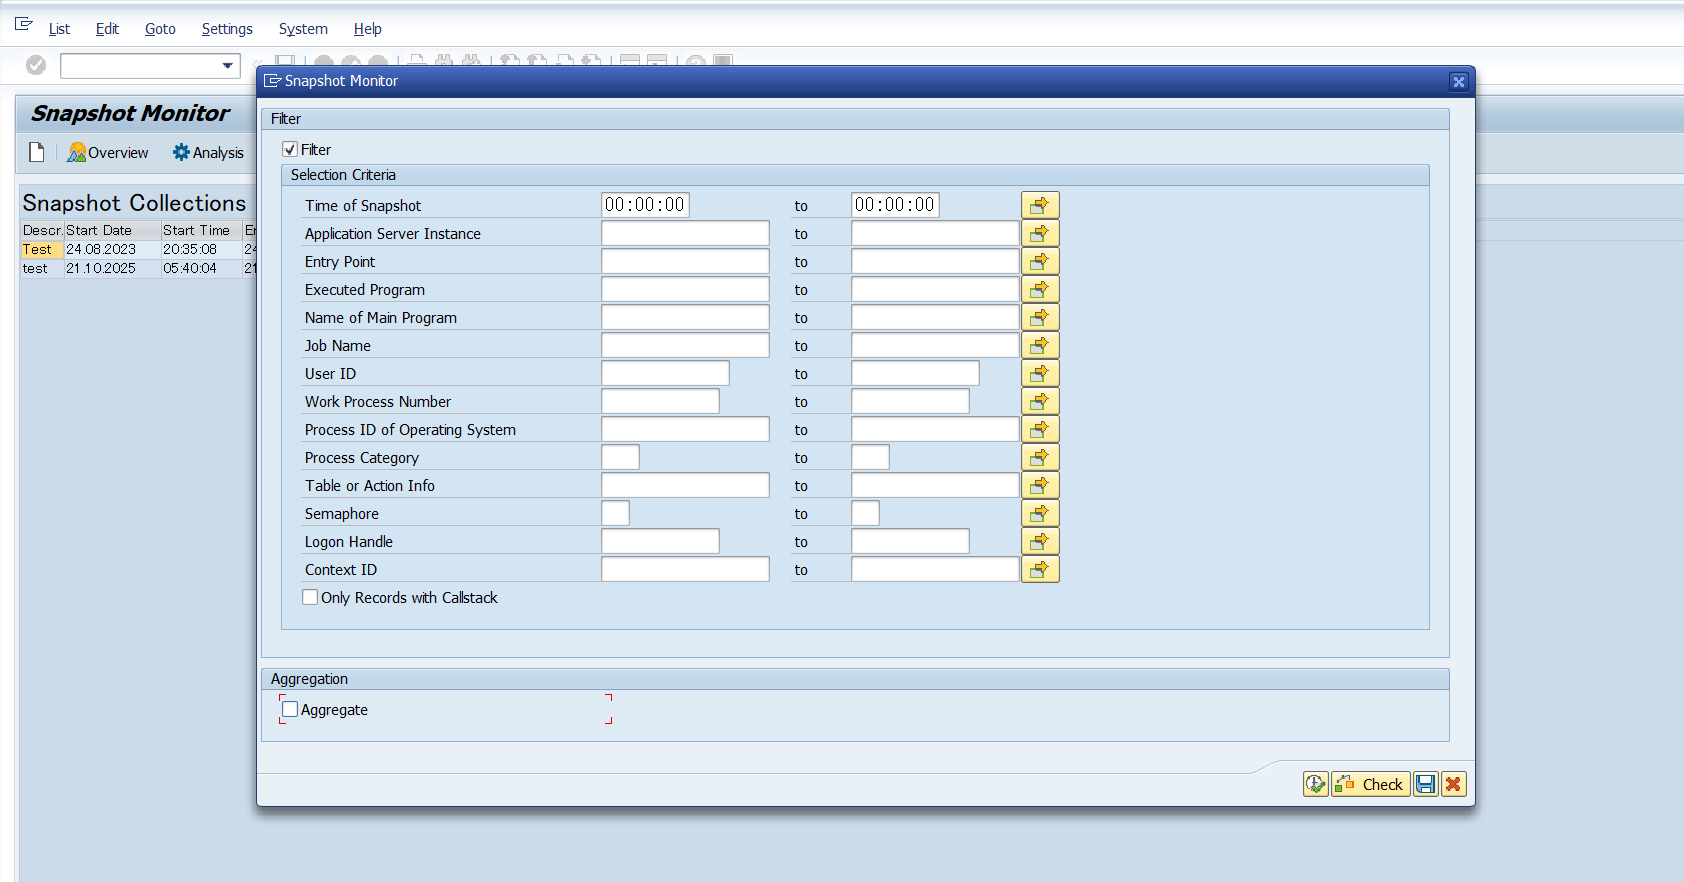
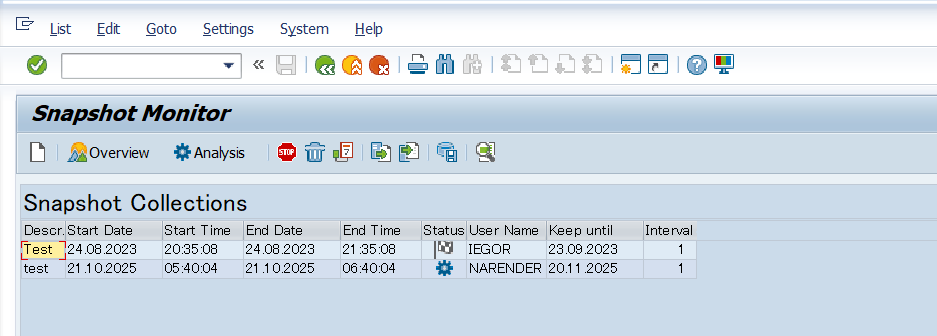
Log into the managed SAP system and execute the transaction /n/SDF/SMON to display snapshot data.
Click F7 to display Sanpshot Monitor data
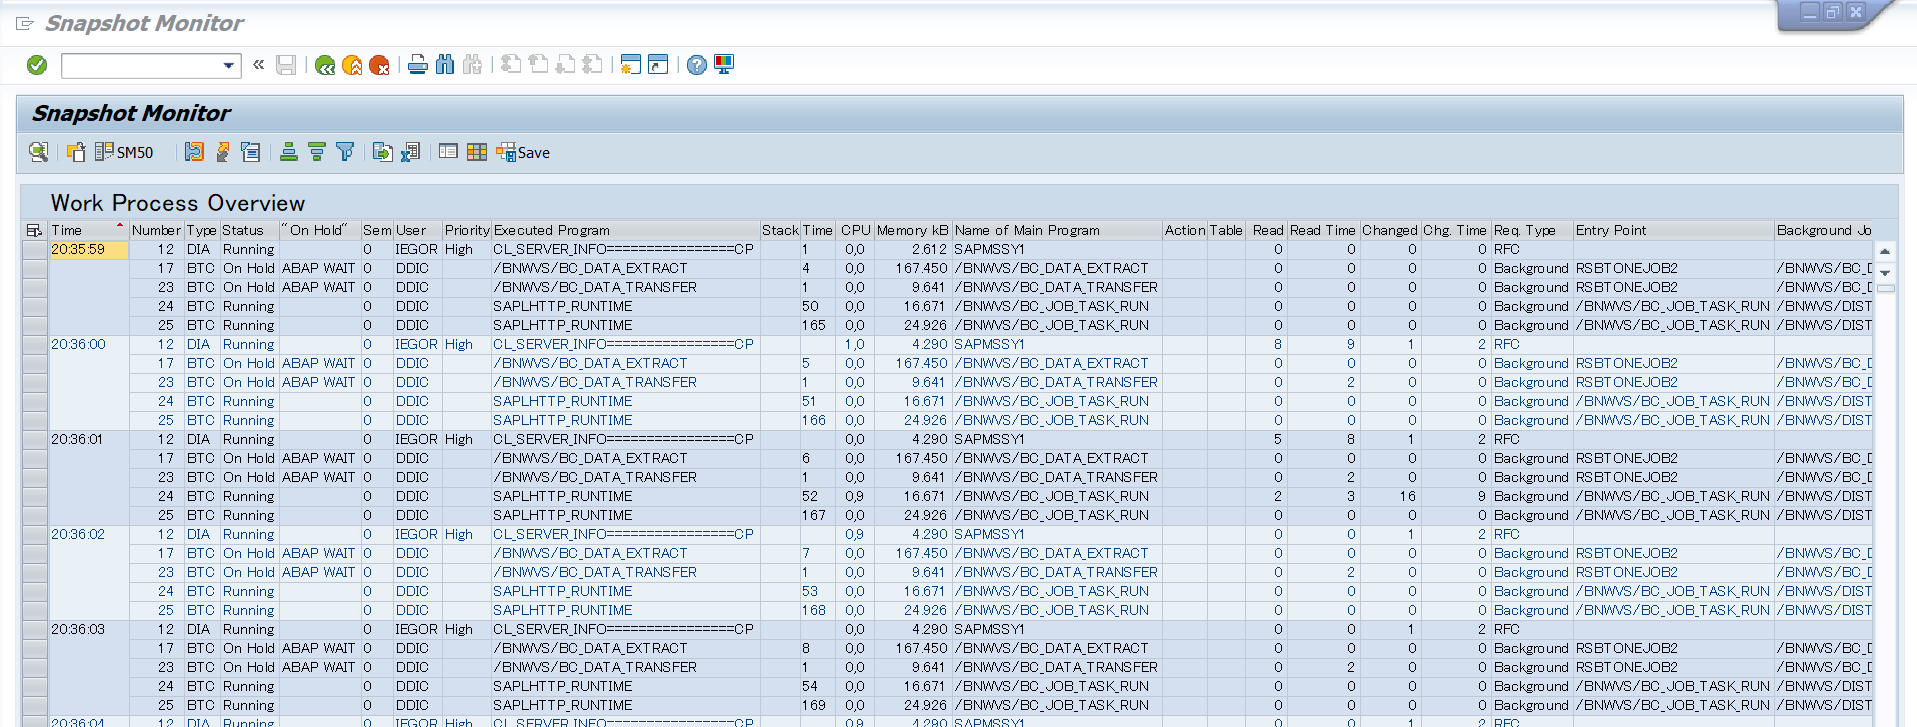
Click on Analysis button to display Work Processes overview